Two well-known Chinese stocks traded in Nasdaq are Baozun Inc (NASDAQ:BZUN) and Baidu Inc (NASDAQ:BIDU). Both shares have enjoyed tremendous upside performance. Baidu has been trading in Nasdaq for more than 9 years while Baozun Inc. is trading for the last 2 ½ years. The multiyear bullish trend in stocks has been very good for shareholders of both of these companies. However since the start of the year the risk off sentiment across equity markets and specifically Chinese stocks has hurt both of these two stocks. Shareholders have lost between 30% and 50% if they did not liquidate their positions.
Using technical analysis and tools like the Ichimoku clouds, we now take a look at each stock separately. Has the long-term bullish trend ended? Has a big correction started this year? What are the price levels bulls need to hold and what are the resistance levels that bears do not want to see broken?
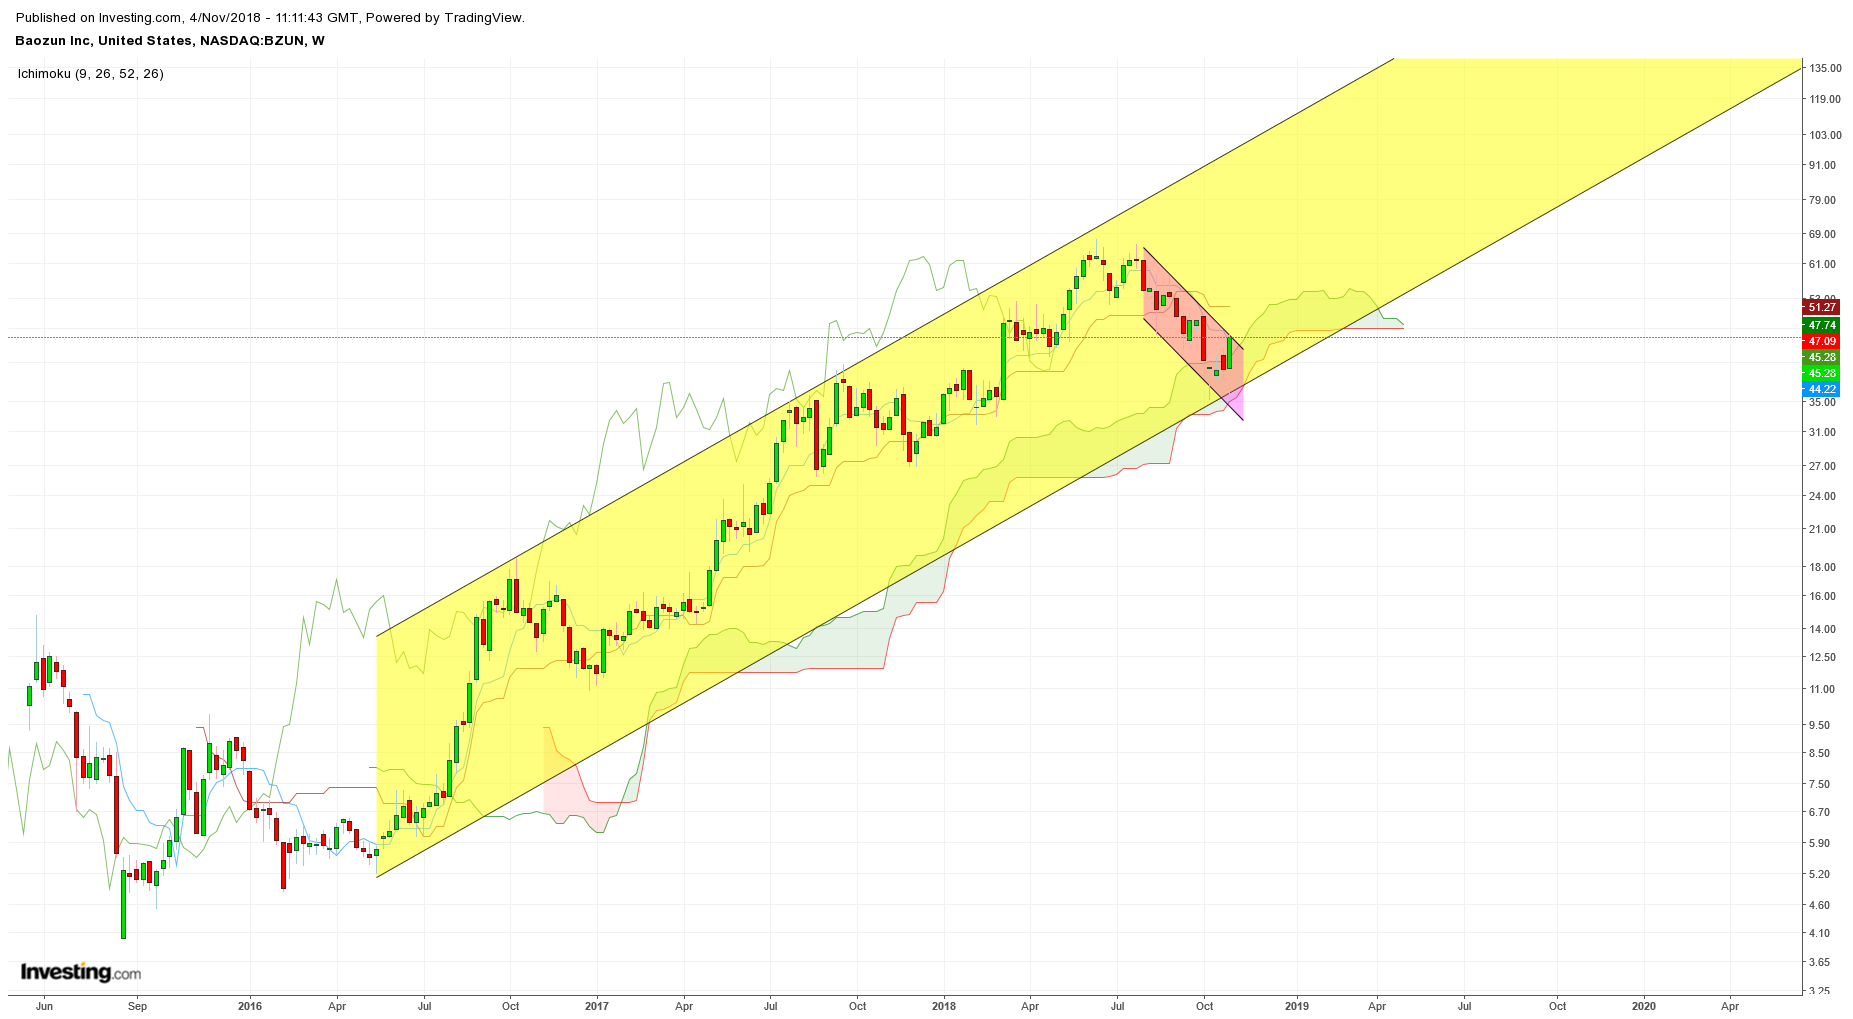
Baozun Inc. share price traded in Nasdaq has been in a bullish trend for more than 2 years and price has risen more than 1500%. Price has recently made a pull back from approximately 67$ to 35$, a correction of nearly 50%. Technically price remains inside the bullish channel from 2016. On a weekly basis price has pulled back towards the Kumo (cloud) support and bounced. This was a bullish sign. If bulls manage and break out and above the short-term magenta downward sloping channel, then we should be more optimistic for the next few months. Breaking above 46-47$ and holding above the weekly Kumo (cloud), will be a sign that would imply the uptrend is intact, and the share price could soon see new all-time highs. However we should also keep an eye for the bearish scenario. In case we see the long-term channel being broken and price fall below 35$, we should expect more downside to come.

Concluding. The share price of Baozun Inc has made a considerable correction over the last few months and the decline has stopped and reacted positively once support was reached. There are high chances of a new uptrend starting for the share price of Baozun Inc.
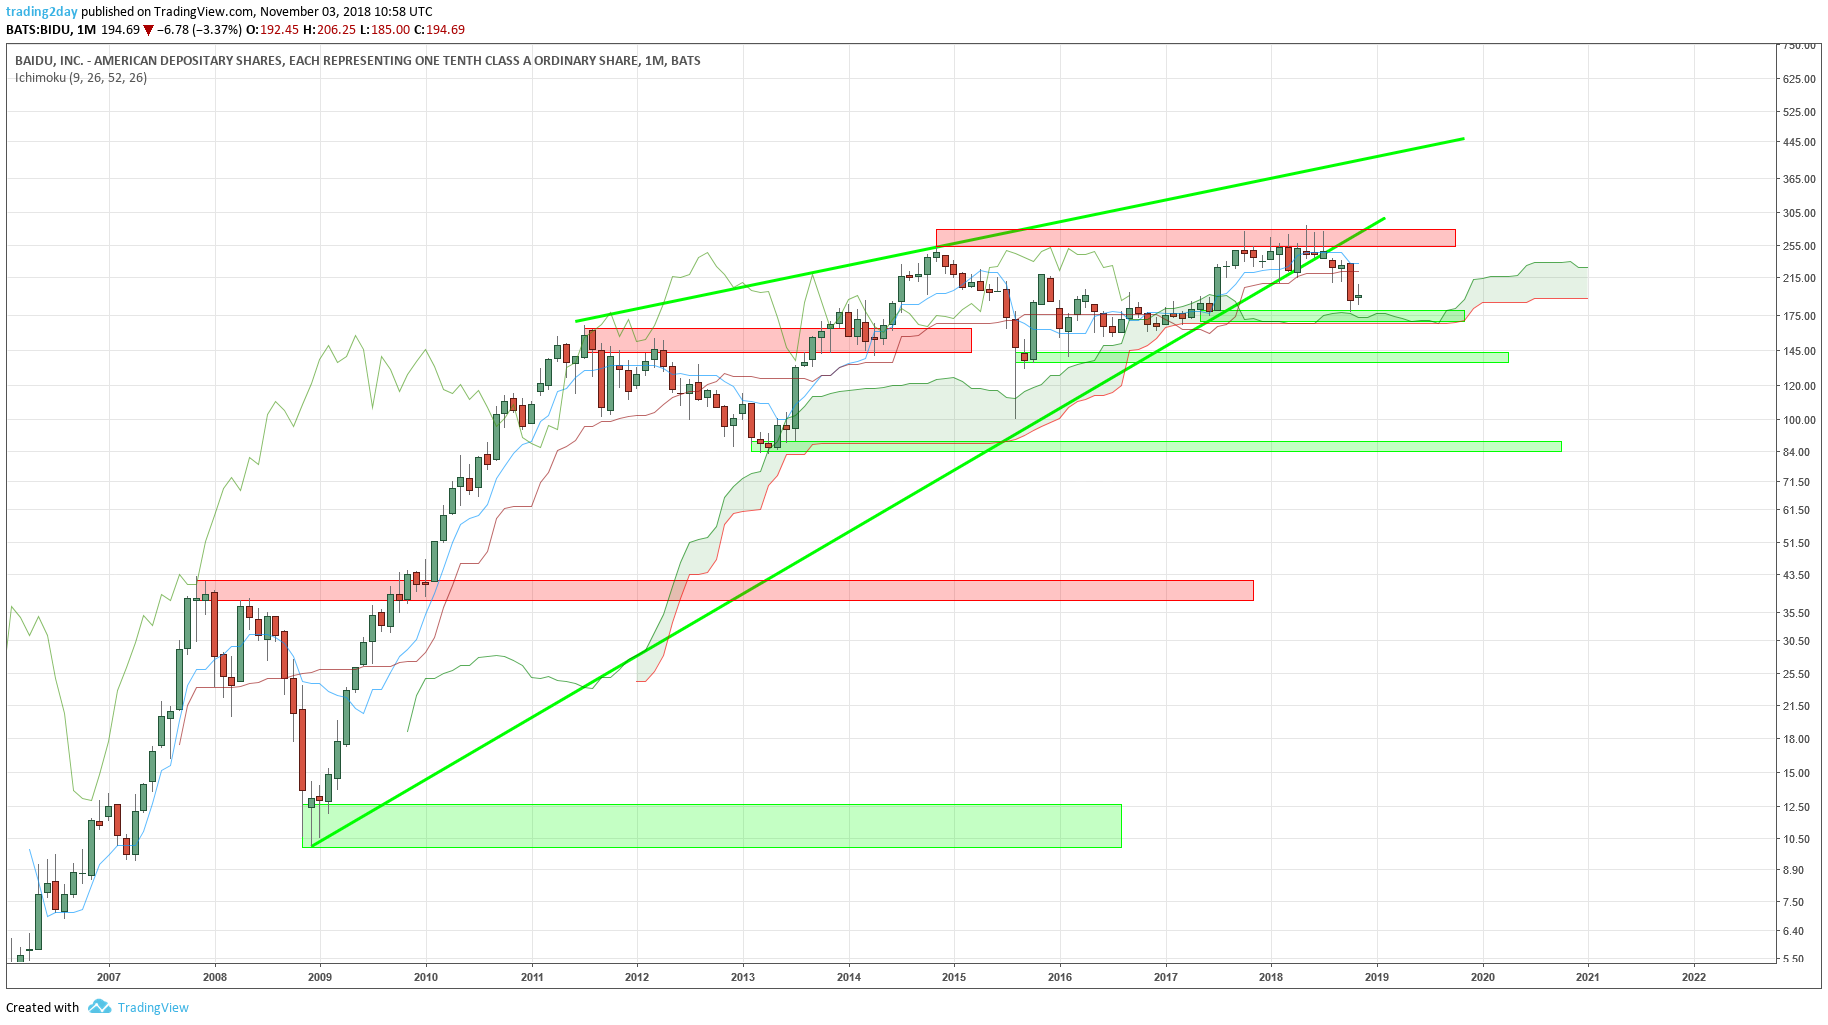
The share price of Baidu Inc. traded in Nasdaq has been running in a bullish trend for more than 10 years resulting in more than 6000% gains. However since past June the share price of BAIDU Inc. has been sold off and lost more than 30% of its value relative to the recent highs. In Ichimoku cloud terms price is still above the monthly cloud support at 177-167$. On a weekly basis, price is below the cloud and resistance is at 226-230$. Baidu Inc. share price is in danger of a major correction as price has broken down and out of the long-term wedge pattern. Breaking below 167-160$ on a monthly closing basis will increase the chances of a move much lower. Maybe towards the 85-100$ price area and previous support (green rectangles). If on the other hand price manages to stay above 177-167$ support and we see a weekly close above 230$, we can assume that the uptrend is not finished and we should expect new all-time highs.

Concluding, having closed last week just below 200$ and taking into consideration the major long-term support and the prevailing long-term trend, any move above 206-207$ would be considered a short-term bullish sign supporting the longer-term bullish trend. Inability from bulls to retake the 210-230$ area over the coming weeks, would be a bearish sign.
Both stocks have been recently trading in a discounted price relative to the recent highs of early 2018. The recent correction could be an opportunity to open positions in these stocks with lower prices. Taking into account the important support levels that should not be broken and the resistance levels that will need to be broken in order to strengthen the bullish scenarios, one can create a strategy and with the correct risk and money management take advantage of this opportunity. The rise in volatility in risky assets gives us the chance to trade the price fluctuations and the deep pull backs in a lasting bullish trend are a gift for long-term investors. All this assuming that you remain optimistic about risky assets like stocks.
Even if you are a pessimist when it comes to markets, the increase in volatility brings also opportunities for short sellers. A 9 year bull trend cannot be followed by only a 6 month risk off period. So if you believe a multiyear correction is due, the important trading levels bulls need to break can also be taken advantage by bears as selling levels with stops close by.
Disclosure: None of the information or opinions expressed in this blog constitutes a solicitation for the purchase or sale of any security or other instrument. Nothing in this article constitutes investment advice and any recommendations that June be contained herein have not been based upon a consideration of the investment objectives, financial situation or particular needs of any specific recipient. Any purchase or sale activity in any securities or other instrument should be based upon your own analysis and conclusions.
