- Investor hopes for the reopening of local economies buoyed as governments plan to relax lockdowns
- Big week for corporate earnings continues
- Oil takes a hit as biggest ETF dumps front-month contract
- A week filled with high profile earnings reports continues: Facebook reports today, after the close; Tesla (NASDAQ:TSLA) and Boeing (NYSE:BA) release results on Wednesday; Amazon and Apple on Friday.
- Investors hungry for data will find plenty on Wednesday: US GDP is expected to plunge, oil stockpiles to have ballooned and the Fed is anticipated to keep rates steady at 0.25%, for now.
- Thursday Germany’s unemployment situation will be highlighted, as well as US weekly Initial Jobless Claims which will likely add significantly to the 26 million Americans already unemployed.
- Friday's releases close the week with manufacturing activity—UK Manufacturing PMI is expected to remain flat, while US ISM Manufacturing PMI is anticipated to plummet.
- The Stoxx Europe 600 Index gained 0.7%.
- Futures on the S&P 500 Index climbed 0.2%.
- The MSCI Asia Pacific Index increased 0.4%.
- The MSCI All-Country World Equity Index rose 0.2%.
- The Dollar Index decreased 0.3%.
- The euro increased 0.2% to $1.0852.
- The British pound gained 0.3% to $1.2468.
- The yield on 10-year Treasuries decreased less than one basis point to 0.66%.
- Germany’s 10-year yield increased two basis points to -0.44%.
- Britain’s 10-year yield climbed less than one basis point to 0.305%.
- New Zealand’s 10-year yield fell 10 basis points to 0.925%.
- West Texas Intermediate crude sank 20.5% to $10.16 a barrel.
- Brent crude dipped 4.8% to $19.04 a barrel.
- Gold weakened 0.8% to $1,701.03 an ounce.
- Iron ore decreased 0.8% to $80.65 per metric ton.
Key Events
Futures on the four main US indices—the Dow Jones, S&P 500, NASDAQ and Russell 2000—rebounded on Tuesday during the European session, after earlier choppy trade, as oil prices once again dropped significantly.
Global governments are collectively considering restarting economies, spurring financial market optimism, as reports of the number of new cases of COVID-19 fall. Still, worldwide, more than 3 million confirmed cases have now been charted, while the number of fatalities is upward of 211,000.
The dollar weakened.
Global Financial Affairs
Markets have become a thicket of risks that traders must now figure out how to navigate: upcoming policy decisions by the Federal Reserve and the European Central Bank; quarterly earnings reports this week from such mega cap tech companies as Microsoft (NASDAQ:MSFT), Apple (NASDAQ:AAPL), Facebook (NASDAQ:FB) and Amazon (NASDAQ:AMZN).
All the while, in the background, lingering unease about the strength of the market persists. Was the fastest transition from a bear to a bull market on record—just three head-spinning weeks—justified? After all, the current U.S. economy, like many other developed and emerging economies in this age of coronavirus, is being fueled primarily by government spending and central bank purchasing.
Notwithstanding, this morning, all four US futures climbed out of negative territory. Except for contracts on the Russell 2000, contracts tested the April 17 highs of their underlying benchmarks.
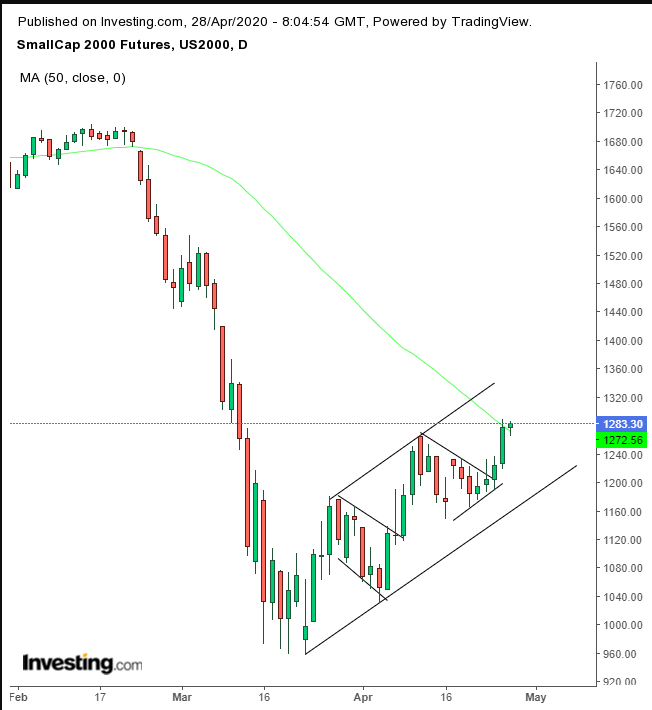
From a technical perspective, small cap futures seem the healthiest, even after we characterized their outperformance as “unhinged greed.” The index completed back-to-back continuation patterns within a symmetrical rising channel, as opposed to the bearish wedges most world benchmarks are developing. Today’s trading also climbed over the 50 DMA.
The Stoxx Europe 600 index ascended to a near two-week high as positive corporate results from companies such as Novartis (SIX:NOVN) and UBS (SIX:UBSG) outweighed energy stocks following another oil crash. Banking giant HSBC Holdings (LON:HSBA) slipped after it cautioned that bad loan charges may climb to as much as $11 billion this year, the highest since the last financial crisis as the coronavirus pandemic halts economic activity around the world.
Earlier today, the Asian session was mixed, with Hong Kong’s Hang Seng outperforming, (+1.32%), while China’s Shanghai Composite lagged, (-0.19%).
As for yields, which appear to be wavering, a fuzzy picture when charting them and including intraday prices regains some clarity when using only closing prices.
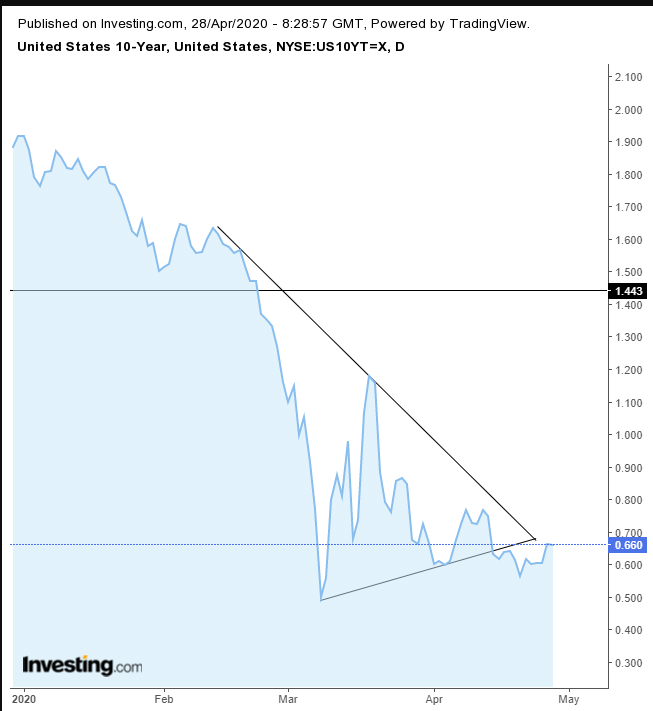
The yield on the US 10-year Treasury may be retesting the focal point of a resistance downtrend line since Feb. 13 and the broken support uptrend line since the March 8 all-time low. The presumption is a continued downtrend, which jibes with our interpretation of the completion of a bearish pattern for equities.
The dollar weakened for a third day.
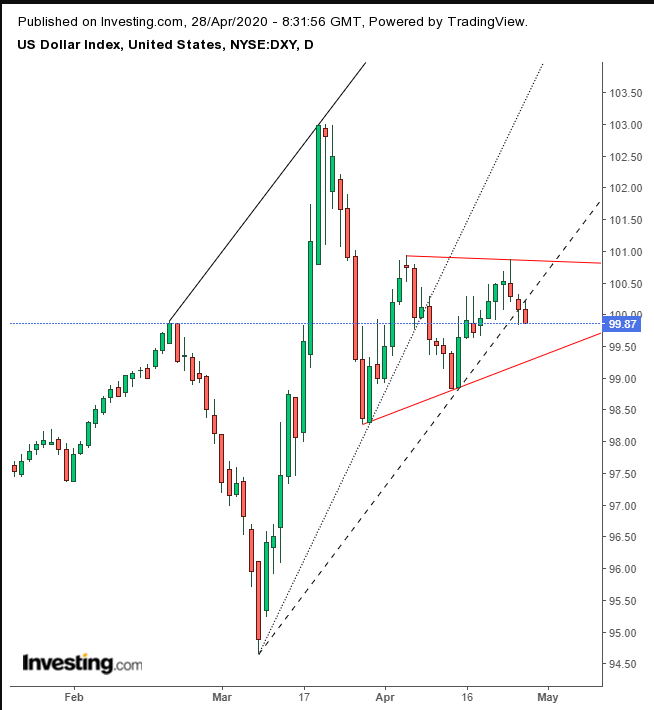
The global reserve currency fell below what could have been a less steep uptrend line, while trading within an ascending triangle, whose bullish implication is counterintuitive to the preceding drop. In other words, right now, there's an unclear picture of supply and demand.
Despite dollar weakness, gold has been falling for the third day in a row, just like the dollar, as investor risk appetite increases, driven by the view that reopened economies will render the last 10 weeks as nothing more than a brief nightmare.
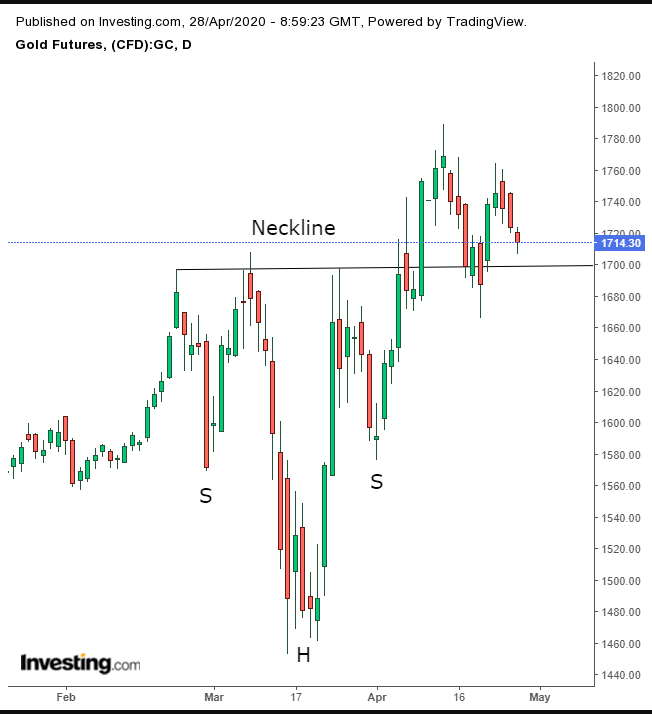
The current dynamic for the precious metal feeds a second return move to the neckline of a H&S continuation pattern. For disciplined traders it can be viewed as a buying dip. Note, the MACD triggered a sell signal upon the first return move to retest the bullish pattern, while the RSI is forming a H&S top for momentum, rendering this a trade suitable only for those who will follow through on their preset trading plans.
Oil continued to inch toward $10, as BP warned of the worst shock ever to the energy market from the coronavirus, and storage fears reemerged after the United States Oil Fund (NYSE:USO), the biggest oil exchange-traded fund, stunned markets when it sold all its holdings of the most active, front month contract in favor of July futures.
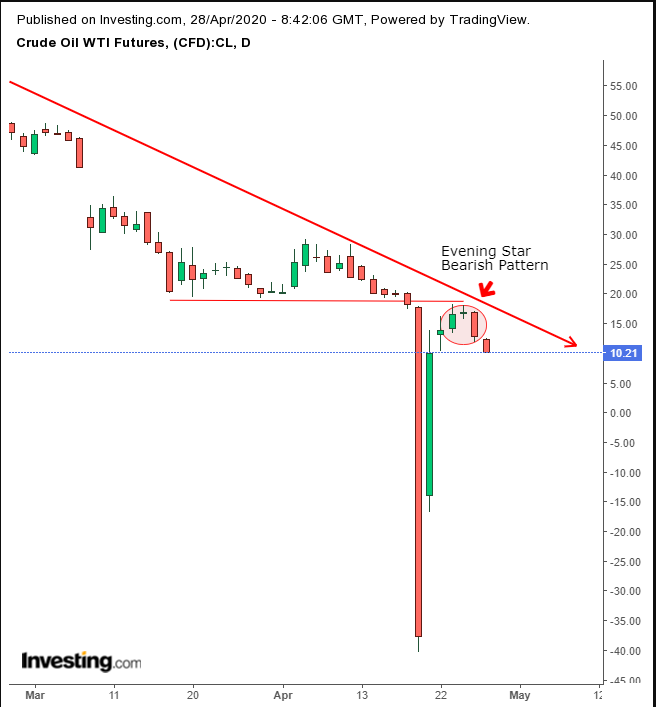
The extended drop in oil prices follows an Evening Star, whose bearish implication is compounded by its position, below the crucial support since March 18 that collapsed into subzero territory on April 20, adding another element of uncertainty, to a market already awash in instability.
As oil once again slipped lower, unanswered questions remain about the commodity and markets. Will the front month June WTI contract also head toward zero and beyond as the dearth of storage solutions and diminished demand persist? Plus, who knew that the downside risk for crude is just as unlimited as its upside risk?
