- US Congressional delays on coronavirus relief package spur sharp selloff during NY session
- The dollar became more valuable, pressuring gold
- This week's remaining earnings releases include those from Cisco Systems (NASDAQ:CSCO) and Applied Materials (NASDAQ:AMAT).
- US weekly Initial Jobless Claims are scheduled for Thursday. A slight downtick, to 1,120K is forecast.
- On Friday, China releases a slew of data for July including industrial production and retail sales figures.
- Futures on the S&P 500 Index rose 0.7%.
- The Stoxx Europe 600 Index climbed 0.1%.
- The MSCI AC Asia Pacific increased 0.2%.
- The MSCI Emerging Markets Index declined 0.2%.
- The Dollar Index decreased 0.1% to 93.60.
- The euro fell 0.1% to $1.1731.
- The British pound decreased 0.1% to $1.3041.
- The onshore yuan weakened 0.1% to 6.951 per dollar.
- The Japanese yen weakened 0.3% to 106.79 per dollar.
- The yield on 10-year Treasuries rose three basis points to 0.68%.
- The yield on two-year Treasuries climbed less than one basis point to 0.15%.
- Germany’s 10-year yield rose two basis points to -0.46%.
- Britain’s 10-year yield gained two basis points to 0.219%.
- Japan’s 10-year yield increased one basis point to 0.046%.
- West Texas Intermediate crude gained 0.9% to $41.99 a barrel.
- Brent crude gained 1% to $44.93 a barrel.
- Gold strengthened 0.3% to $1,917.81 an ounce.
Key Events
US futures for the Dow Jones, S&P 500, NASDAQ and Russell 2000 pushed higher on Wednesday, and European shares rose, lifted by hopes of additional UK stimulus after poor GDP, showing Britain's economy had entered a recession, and Industrial Production data that was, nonetheless, better than anticipated.
Treasuries extended a selloff and gold found its footing.
Global Financial Affairs
Though Asian indices struggled to break free of the gloom that remained after yesterday's Wall Street rout, triggered by fading hopes for additional US stimulus, ES contracts climbed this morning, breaking free of a range since yesterday’s close of the S&P 500 benchmark.
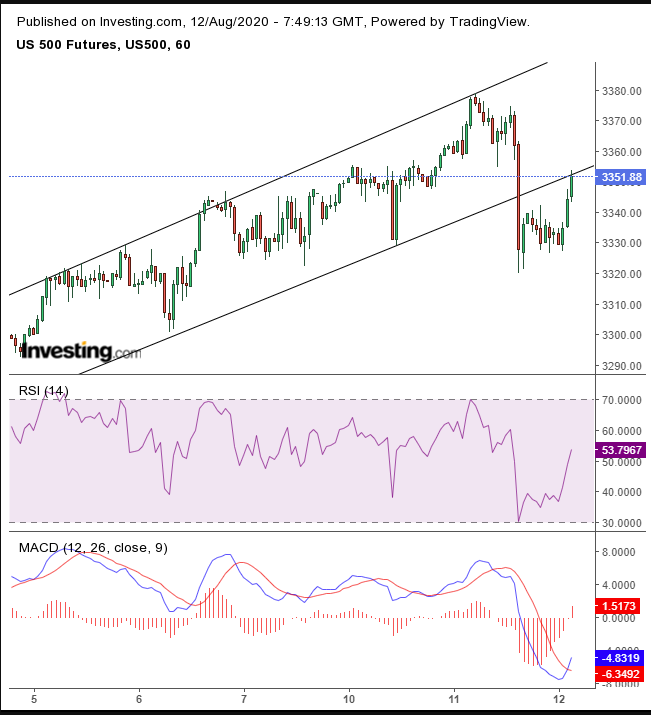
While both the MACD and RSI bottomed out, contracts on the S&P 500 found resistance by the bottom of a rising channel, in place since Aug. 3, that yesterday failed to keep the price within its boundaries.
The STOXX Europe 600 Index recovered from an initial dip fueled by technology and healthcare shares. However, a jump in telecoms stocks boosted the pan-European index after Switzerland's Sunrise Communications (SIX:SRCG) received a $1 billion takeover offer from UK-based Liberty Global (NASDAQ:LBTYA). Shares of the Swiss company jumped more than 26%.
Trade in Asia was mixed this morning. Hong Kong’s Hang Seng outperformed, (+1.4%), as Chinese funds made record purchases to stabilize the city’s economy after months of civil unrest; a string of high-profile listings of giant tech companies added to the exuberance. China’s Shanghai Composite underperformed for a second session, (-0.6%), as slower growth in bank lending offset a recovery in car sales, as US-Sino diplomatic headwinds continue looming large.
Tuesday, during the New York session, US stocks suddenly dropped in the final two hours of trade as investors locked in profits on some of the Wall Street rally’s biggest winners after Republican Senate Majority Leader Mitch McConnel said a stimulus deal could take weeks to pass.
In the aftermath, the SPX up-ended what could have been an eight-day rally, its longest upswing since the spring of 2019, which took the benchmark to less than 0.4% from its Feb. 19 all-time high.
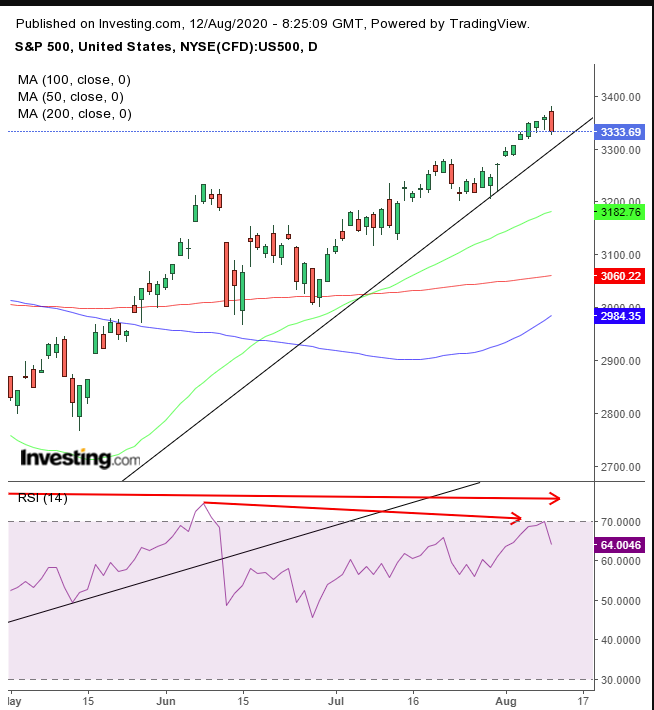
The late-session selloff completed a double-bearish pattern: a Bearish Engulfing pattern that also confirmed Monday’s hanging man. The RSI curved down from its 70 oversold level. The momentum-based indicator failed to climb above its June high, forming a double negative divergence, including slowing momentum from January 2018. This contrasts with a rising price—along the pattern of its long-term broadening pattern.
Yields, including for the US 10-year Treasury benchmark, climbed for a fourth straight day.
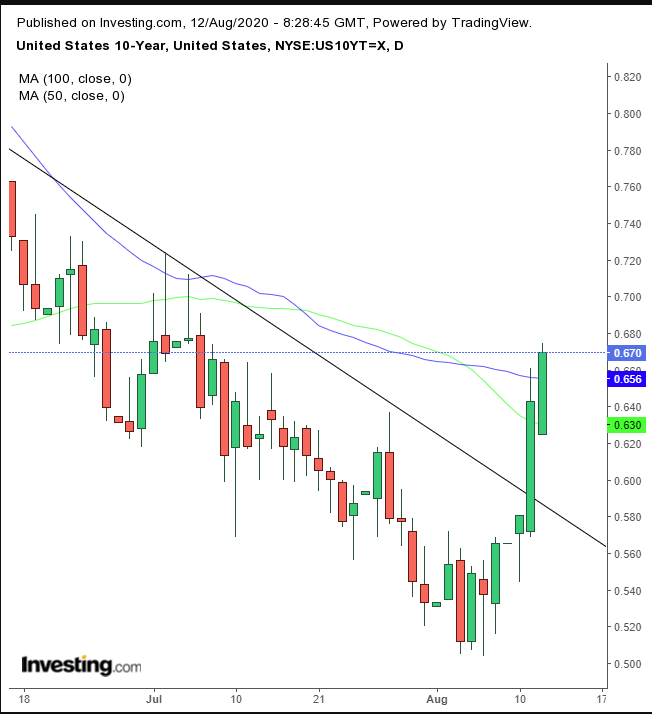
Rates broke free of a downtrend line since June 16, and closed above the 100 DMA, after bouncing off the 50 DMA.
The dollar gave up gains, even after news of the delayed stimulus boosted greenback demand.
All charts powered by TradingView
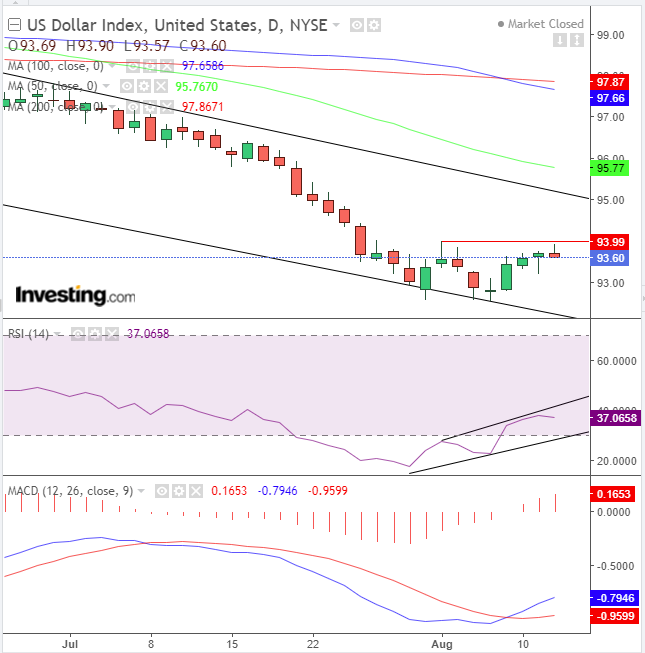
Yesterday’s late rebound for the global reserve currency formed a hanging man on the chart. If today’s trading takes the Dollar Index below 93.62, and it closes at that point, it will have completed a shooting star, confirming the bearish intent of yesterday’s hanging man. This would also reaffirm the bearish engulfing pattern over a shooting star which occurred early in the month.
On the other hand, should the dollar break through the 94 resistance, it will have completed a small double bottom. The larger technical forces in play are the conflict between the falling channel since April and the rising channel since 2009.
Delayed stimulus provoked traders to quickly take advantage of a sudden, newfound arbitrage opportunity, increasing demand for the now-more-valuable dollar, at the expense of gold.
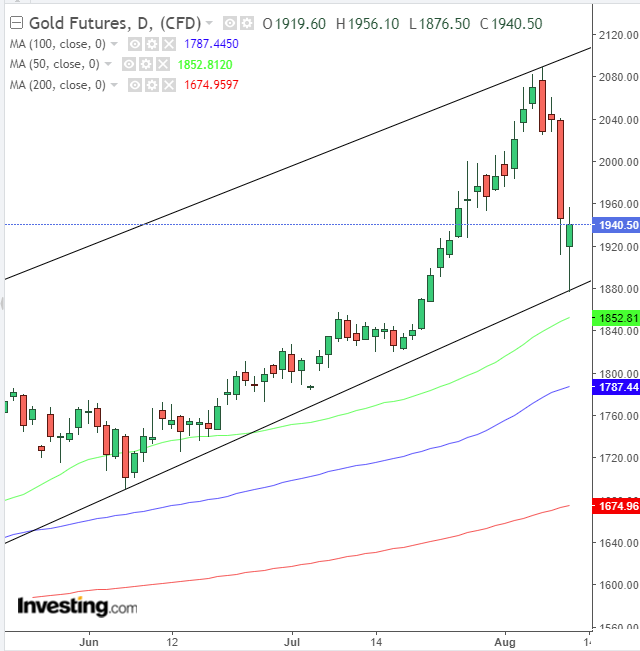
The precious metal fell for the third day out of four, after it tumbled the most in seven years on Tuesday. It's now bounced off the bottom of its rising channel, paring almost all of today’s losses, posting a possible, imperfect hammer, with an upper shadow.
Oil wiped out yesterday's losses.
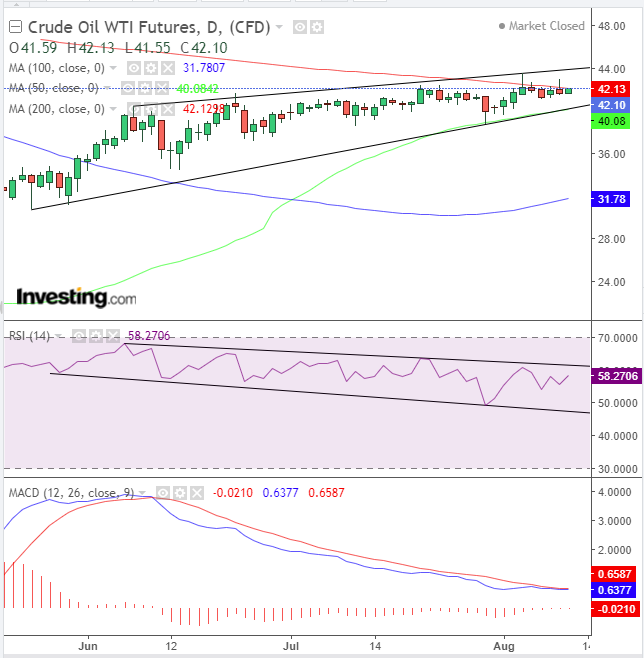
As WTI climbed, it continued to churn in a counter-intuitive rising wedge, following a rally rather than a descent. Today is the sixth day in a row that the price took on the 200 DMA but failed to surpass it. The RSI and MACD remained in a bearish posture.
