Most US stocks slipped for a third day, echoing a third consecutive drop in retail sales
Materials and Industrials lag on escalating trade war worries
Financials fall on lower interest rate outlook
Next week's Fed rate decision likely next big market mover
Investors eye Secretary of State for clues to trade war path
Brexit hopes lift the sterling
Japan industrial production is out on Friday.
Inflation data on Thursday is a focal point in the euro area.
EU27 government officials discuss the European Union’s Brexit position.
The STOXX Europe 600 Index increased 0.3 percent.
The MSCI All-Country World Index gained 0.1 percent.
Futures on the S&P 500 climbed 0.2 percent.
The UK’s FTSE 100 advanced 0.1 percent.
The Dollar Index gained 0.05 percent to 89.75.
The euro fell less than 0.05 percent to $1.2364.
The Japanese yen increased 0.2 percent to 106.14 per dollar, the strongest in more than a week.
South Africa’s rand fell 0.4 percent to 11.8183 per dollar, the biggest fall in a week.
The British pound rose 0.1 percent to $1.3977 with its fifth consecutive advance.
The yield on 10-year Treasuries advanced less than one basis point to 2.82 percent.
Germany’s 10-year yield was unchanged at 0.59 percent, the lowest level in seven weeks.
Britain’s 10-year yield climbed less than one basis point to 1.441 percent.
Key Events
Most US stocks fell for a third straight day yesterday, posting their longest losing streak since the February 27-March 1 selloff.
The S&P 500 slipped 0.57 percent, to a total three-day dip of 1.33 percent, dragged down by Materials (-1.23%), Financials (-1.13%) and Industrials (-1.09%). Materials and Industrials shares fell due to their sensitivity to trade war headwinds; Financials shares dropped on a recent shift in outlook for a slower pace of interest rates hikes. The Fed's rate base determines the cost of loans, which represent a significant slice of bank profits.
The only two sectors in the green were Utilities (+1.03%) and Real Estate (+0.19), the former outstripping the latter by 5:1.
Technically, the March 13 high for the benchmark index exceeded the previous February 27 peak, thereby completing the second peak required to make the bounce from the February 9 low a bottom and the rebound an uptrend. Despite the third-day decline, after temporarily dipping below the 50 dma, it became support, with the price bouncing above it.
The Dow Jones Industrial Average also slid for a third day, down 0.99 percent, for a total decline of 2.27 percent. The Dow underperformed the SPX; Its mega-cap multinational component companies rely on global market share for sales growth and would therefore take a harsh hit from a trade war.
Technically the Dow is also significantly weaker. Its March 12 high undershot the previous February 27 peak by 1.4 percent, questioning the endurance of the February 9 rebound. It found resistance by the 50 dma. Currently, it is testing the rebound’s uptrend line and the 100 dma .

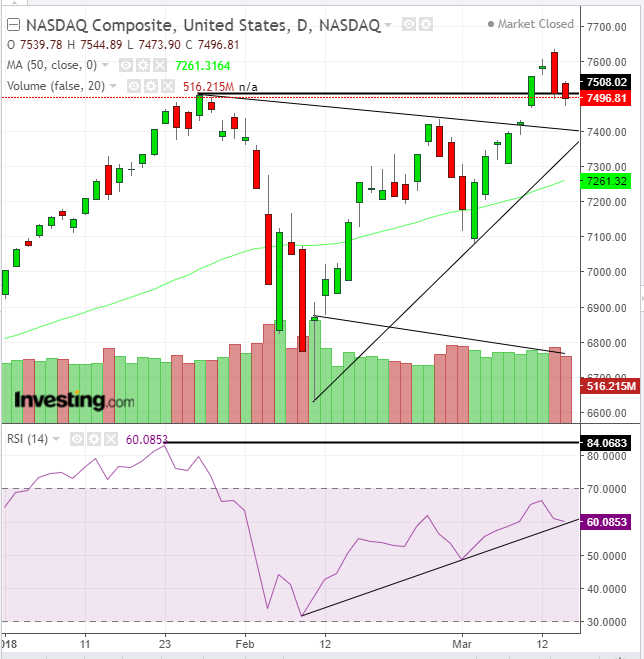
The NASDAQ Composite fell for a second day, dropping 0.19 percent, for a two-day loss of 1.17 percent. The tech-heavy index outperformed among its major US peers. Not only did its last rally hit a higher peak, as did the S&P 500. It also beat the January 26 peak, posting two consecutive record closes and a third record high on Tuesday, before closing in the red.
Technically, the index is more than 3 percent above its 50 dma and still above the January peak, where it seemed to have found support yesterday. However, as analyst and trader Yonatan Shaked warned in a LinkedIn post, the NASDAQ Composite lacks confirmation of the long-term continued trend via another major index—the SPX or the Dow. This is the Dow confirmation theory, whereby if things were as great as they appear on the NASDAQ chart, they would be visible in the other indices as well. Shaked is also bearish on the fact that declining volumes suggest a lack of participation—a sign that demand may run out.
We could point to another divergence: the momentum failed to support the price breakout, as seen on the RSI. A negative divergence signals that prices may follow momentum down. Moreover, the RSI is testing its own uptrend line, and should that falter, it would increase the probability that the price falls below its uptrend line.
On the other hand, the decline – in the form of a Dark Cloud Cover candlestick formation – was not followed by exceptionally high volume, which would have suggested strength in the new downward direction.
The test to establish whether the uptrend resumption would survive is whether it would stay above the uptrend line since the bounce of February 9. Note that the downtrend line from January 26, above which the price broke up may be considered the top of a triangle, bullish in an uptrend. 7,400 may be the key price level to determine the trend.
Global Financial Affairs
This morning, stocks posted mixed results in Asia, as equity markets are still vexed by fears that US tariffs would hurt company earnings. In Japan, the Nikkei 225 eked out a 01.2 percent gain, while the broader TOPIX remained flat. Ironically, retailers outperformed just as their US counterparts posted a third consecutive monthly sales plunge yesterday.
China’s mainland Shanghai Composite also remained flat, while the Shenzhen Composite declined 0.22 percent – like in Japan – led by consumer stocks. The blue-chip Shanghai Shenzhen CSI 300 gained 0.57 percent, and shares listed on Hong Kong’s Hang Seng also ticked higher, by 0.22 percent. Shares on Australia’s S&P/ASX 200 dropped 0.24 percent, led by losses in the financials sector.
Still, stocks in Europe found their way up, as the STOXX Europe 600 climbed for the first time in three days, led by the insurance and technology sectors.
Meanwhile, S&P 500 Futures suggest the underlying index is set to open in positive territory.
The current market dynamic is dominated by two issues: the potential tightening of the Federal Reserve's monetary policy and the threat of a looming trade war.
The next market mover may be the Fed’s interest rate decision next week. The US Labor Department report showed on Tuesday that PPI—a key measure of underlying product price pressures excluding volatile food, energy and services—rose 0.2 percent. While the indicator was flat on a month-on-month basis, the year-on-year reading was boosted to 2.7 percent. This marks the biggest jump since August 2014, supporting the view that higher inflation is on its way.
Meanwhile, the three-day decline in US stocks echoes the third consecutive drop in monthly retail sales. The Commerce Department report said that sales slipped 0.1 percent last month, posting their longest losing streak since April 2012.
The persistent weakness in retail spending is at odds with consumer confidence which has hit a 17-year high, as sentiment was buoyed by the government's $15 trillion income tax cut and a 4.1 percent unemployment rate—the lowest in 17 years (in delightful symmetry with the consumer confidence reading).
This dissonance may have economists scratching their heads and money managers beginning to wonder whether the juicy economic growth they have been celebrating may be withering at the core.
Meanwhile, Treasury yields held near February lows on bets the Fed won’t signal quicker interest-rate hikes at its policy meeting next week.
Regarding trade war worries, investors are keeping a wary eye on how Rex Tillerson's replacement as Secretary of State, Mike Pompeo, will sway the potential path to a trade war. He and the president share similar views on diplomacy. On March 11, Pompeo told Fox News Sunday:
This administration is prepared and engaged in pushing back against the Chinese threats so that we can have a good relationship with China in a way that the world desperately needs.
As CIA director, the perception is he brings gravitas to the president’s views on foreign governments. With regard to stock prices, it’s noteworthy that the previous selloff began on February 27, two days before the president announced his tariff plans. With no other apparent explanation, the decline could be attributed to informed money, which knew something was brewing and acted accordingly.

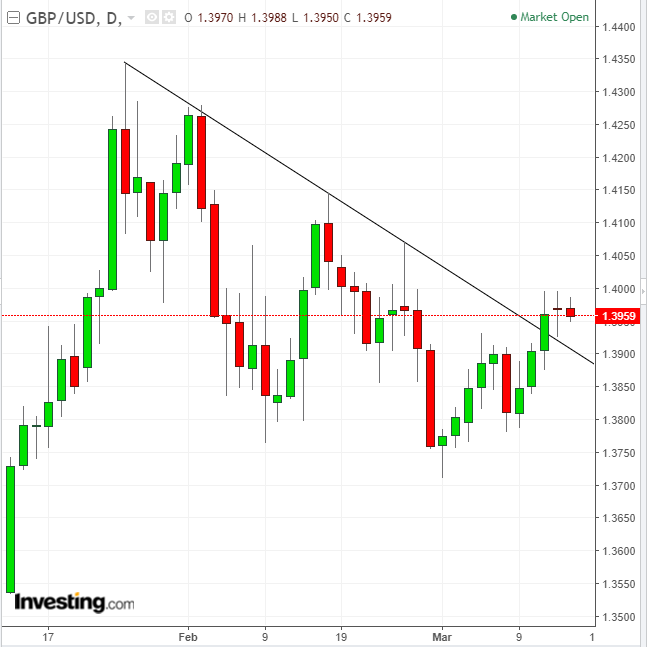
The pound advanced, as it appears that the UK will win a two-year grace period after leaving the EU. The price extended an upside breakout to its downtrend line since January 25.
The yen gained for a second day, paring its near 2 percent loss since the March 2 low to 0.75 percent.
Oil held gains near $61 a barrel, as signs of stronger U.S. fuel consumption balanced OPEC expectations that, for the first time, new supplies from its rivals will exceed demand this year.

A congressional hearing on cryptocurrencies yesterday turned into a Bitcoin bash fest. Members of Congress raised concerns about the nefarious uses of Bitcoin and the lack of capital protection for cryptocurrency investors. Democratic Representative Carolyn Maloney said:
They're pouring their life savings into virtual currencies and they stand to lose a lot of money when this bubble eventually bursts
Representative Brad Sherman was even harsher. He said, "cryptocurrencies are a crock."
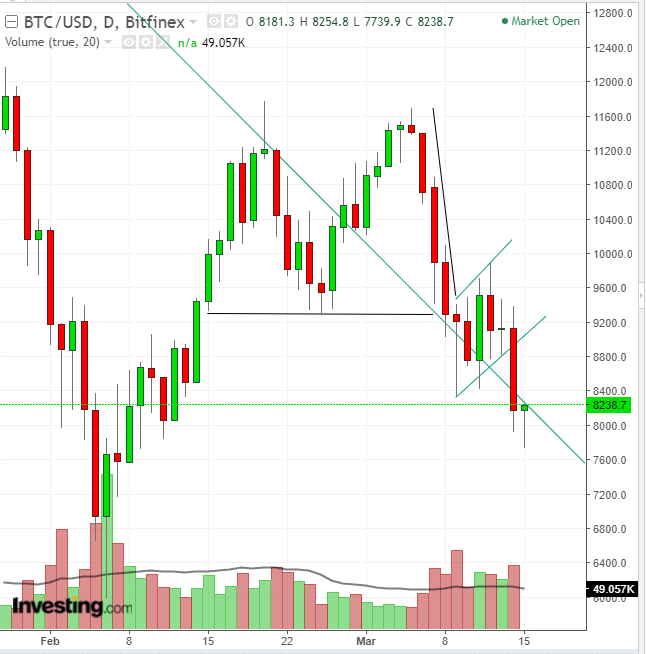
Bitcoin bounced from a $7,739.9 low, to stabilize around yesterday’s closing price at about $8,170 as of 5:16 EDT. Technically, the price completed a clear small double-top and a bearish Rising Flag, as it was supported by higher volume than during the consolidation. As well, it returned to the falling channel. However, the digital token seems to be fighting back, forming a potential bullish Hammer, upon a close. Still, return moves normally occur after breakouts.
Up Ahead
Market Moves
Stocks
Currencies
Bonds
Commodities
