-
US markets reopen after Presidents’ Day holiday
-
Yields and currencies drive markets
-
Focus on Treasury Auction 11:30 EST
-
Oil climbs above $62 as OPEC, Russia promise to support prices
-
Bitcoin caught between mixed news reports
Key Events
US markets were closed on Monday in observance of the Presidents’ Day holiday. On Friday, US stocks listed on the S&P 500, the Dow Jones Industrial Average and the Russell 2000 extended a rebound to a sixth day, capping their best five-day performance in five years.
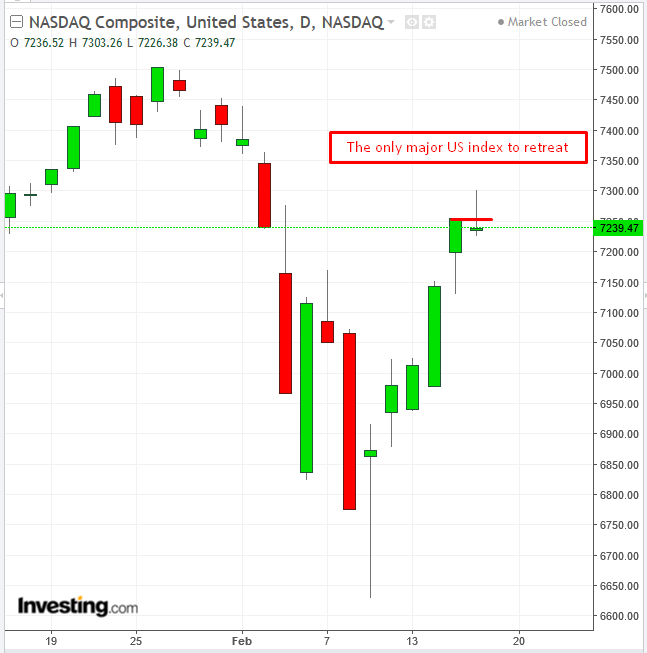
New indictments related to Russian interference in the 2016 presidential elections led to stocks paring back the stronger advance seen in the previous days, with the NASDAQ Composite—which tends to react most strongly when investors flip the risk switch to either on or off—the only major US index that ended the day lower, thus breaking a five-day winning streak. Growth stocks were sold off, including Technology stocks, in favor of defensive stocks and safe havens.
The Russian government denied the allegations, as one would expect. Either way, the potential impact on US and, indeed, global stocks going forward will hinge on any further reaction or measure adopted by US officials, rather than from anything released by Russia.
As well, since 2016's Brexit vote, equity traders have proven to be resilient to political risk. Then again, it’s easy to consider it resilient when stock prices keep climbing, defying the laws of gravity; nevertheless, it's considered foolhardy when equities crash and market observers start wondering how they could have let things go this far. For a fuller analysis of US See Sunday's Week Ahead for a fuller analysis of last week's US stock activity.
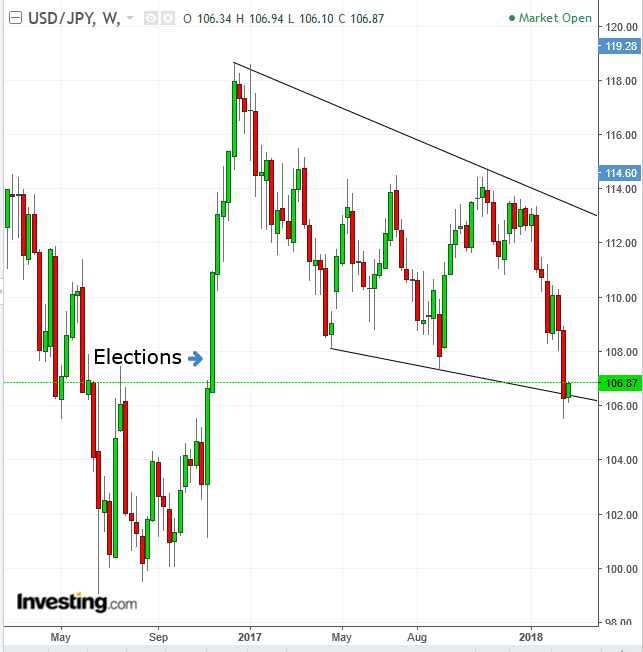
Yesterday, Asian equities posted gains across the board, led mainly by Japan’s TOPIX and Nikkei 225. Australia’s S&P/ASX 200 and South Korea’s KOSPI, also saw their best week since September 2016.
Japanese stocks helped propelling the gains, as they benefited from the weakening yen. A weaker currency cheapens a country’s exports through the exchange rate. This has an even bigger impact on a country like Japan, whose economic growth is heavily dependent on exports. As well, stocks become cheaper to foreign investors, whose home currency can now buy more yen and therefore more shares. Markets in Hong Kong and China remained closed for the Lunar New Year.
While investors have been speculating about a potential balance sheet reduction by the Bank of Japan, Governor Haruhiko Kuroda avoided discussing monetary policy in a parliamentary appearance, leaving traders guessing. Based on the central bank governor’s track record, he is likely to stall as much as he can get away with, as such a statement would further strengthen a yen that is already excessively strong for a country so reliant on exports.
Ironically, despite Japanese exports posting 12.2 percent growth YoY, beating the 9.4 percent forecast quite handsomely, the yen retreated from a 15-month high on Monday as imports also climbed 7.9 percent, beating the 7.7 percent forecast, tallying Japan’s first trade deficit in 8 months.
Since advances in Asian markets were mostly explained via the weaker yen, they were not indicative of a continued global rally from last week, led by US indices. That's why the STOXX Europe 600 index didn’t participate in the gains but instead fell for the first time in four days, dragged down by auto and consumer stocks.
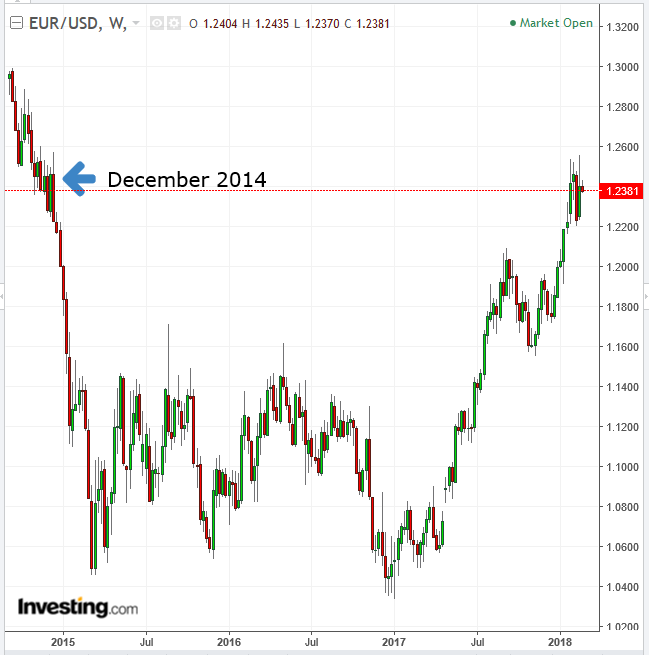
As opposed to what happened with Japanese stocks, which benefited from a yen hovering at pre-Trump levels near a 15-month low, European shares suffered from the euro at its highest level since December 2014.
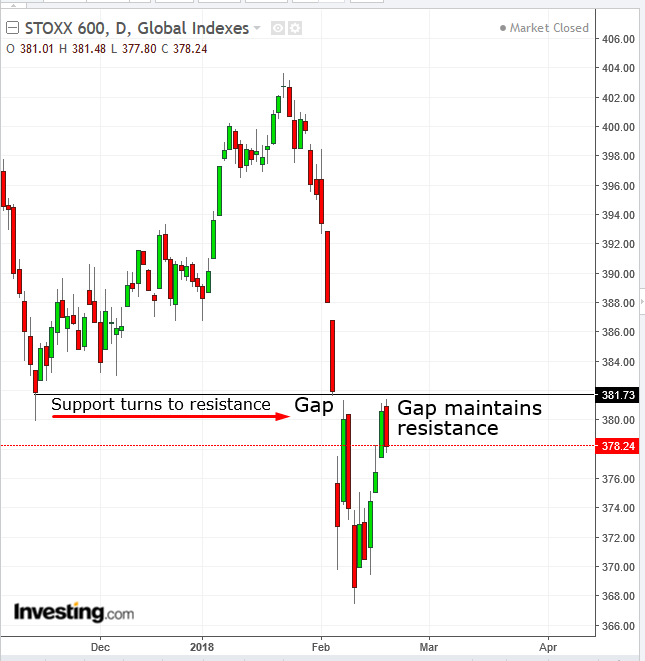
Already weighed down by a strong euro, it didn’t help that the pause in US trading left European markets in the spotlight, leading investors to sell or even short European stocks.
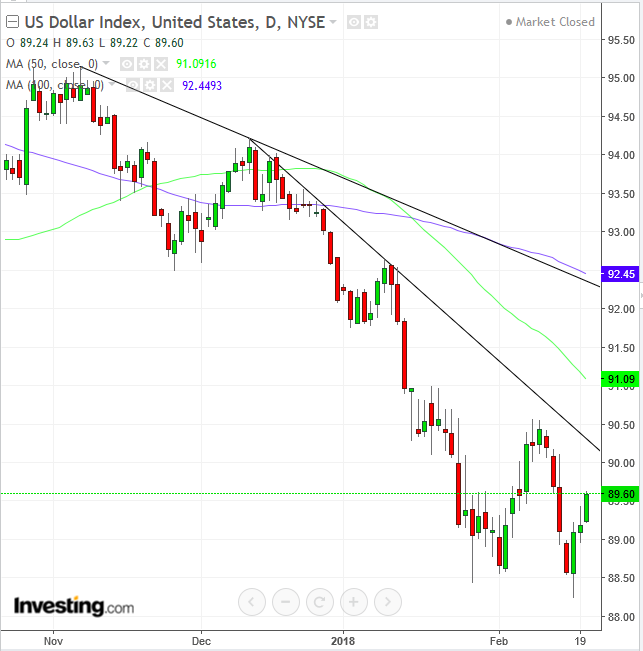
This may be an appropriate time to appreciate the role of the downtrend in the dollar, which is at is weakest level since December 2014, in a mirror image of the euro and amid the strongest US equity rally since 2013. A weaker currency lowers the current account deficit, leading to increased demand by foreign investors, whose local currency enjoys a added buying power. The greenback is consolidating beneath a support line since May 2015, whose downside breakout may suggest a continuation of the decline. Notice how the 100DMA (blue) realigned itself with the downtrend line since November and the 50DMA (green) is catching up with the steeper downtrend line since December.
Global Financial Affairs
This morning, stocks are painting a different picture, suggesting last week’s rally may have come to an end. The main Asian benchmarks declined alongside S&P 500 Futures, while European shares are advancing.
Japan’s TOPIX fell overnight, halting its recent rally—its second-strongest this year. Shares listed on Australia's S&P/ASX 200, South Korea's KOSPI and Hong Kong’s Hang Seng also lost some ground, while the Shanghai stock exchange will remain closed until Thursday in observance of China's Spring Festival.
Stocks in Europe are in the green but posting paltry 0.25 percent gains, and stalling.
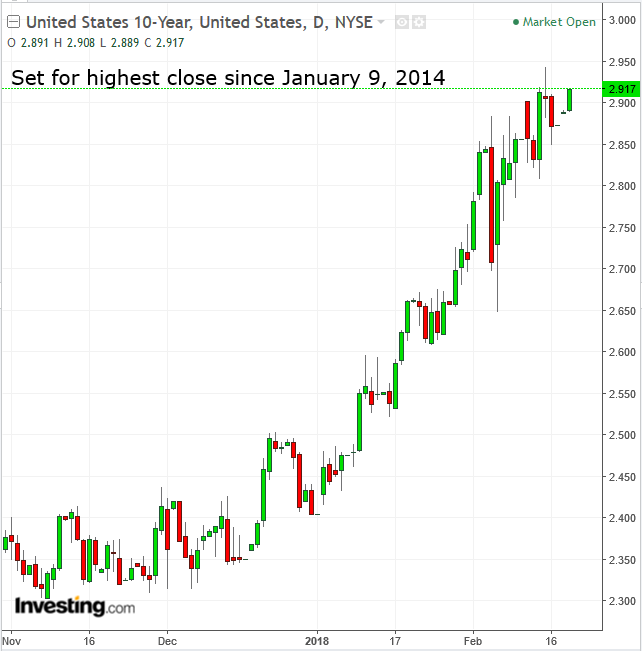
Focus will surely return to US Treasurys today, after yields rose to a four-year high, setting off the worst two weeks in US equity markets in two years. A Treasury auction is scheduled for today at 11:30 EST with 3-month bills, 4-week bills, 6-month bills and 2-year notes on offer. Absent any other economic data, the auction is likely to be scrutinized for signs of how steeply US bond yields can continue their uptrend, as, at 2.9 for the 10-year, they are already set for their highest close since January 9 2014, while global bonds resumed a selloff.
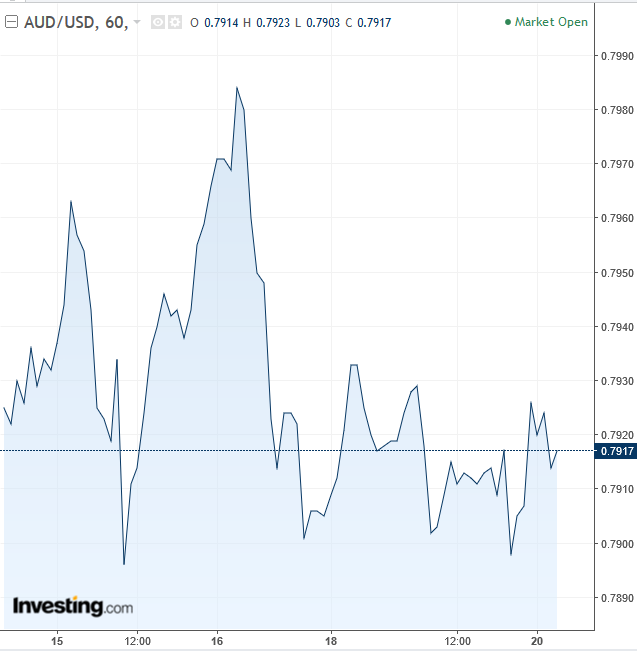
The Reserve Bank of Australia reiterated in the minutes of this month’s policy meeting that inflation is expected to “only gradually” accelerate as the economy strengthens and wage pressures increase. The lukewarm announcement left traders guessing as to the trajectory of the Australian dollar, extending a range.
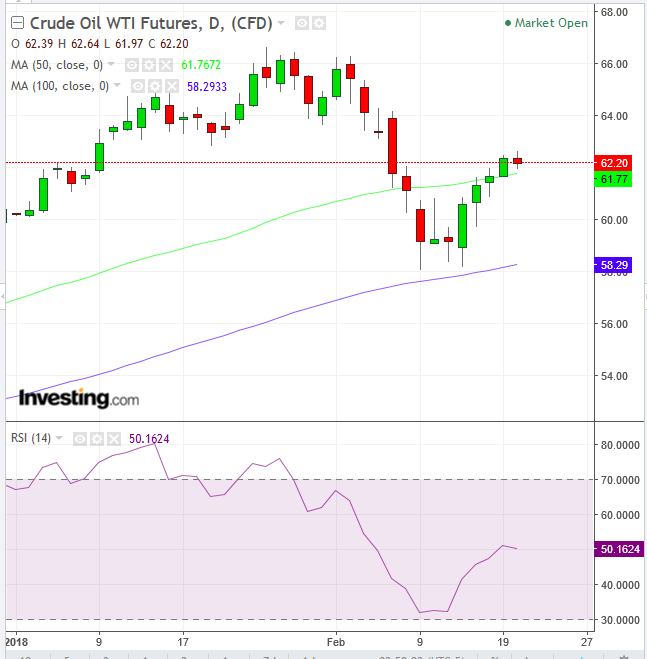
The price of WTI crossed over the $62 threshold for the first time in over a week, after investors learned yesterday that the OPEC-Russia alliance may be extended beyond 2018, as the world’s largest producers vowed to continue to support market prices. However, crude oil prices declined this morning, albeit remaining above $62, supported by the 50 dma (green), after the 100 dma bounced at the $58 level. The RSI is curving back down, demonstrating weakness in momentum.
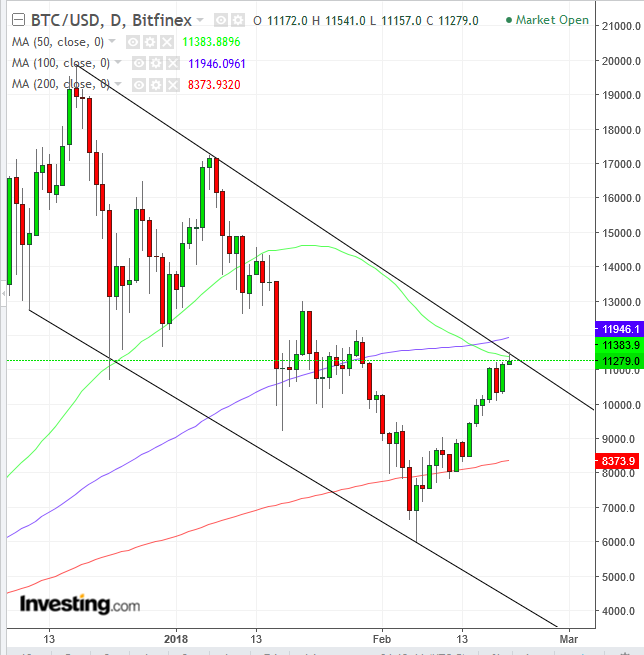
Bitcoin climbed above the $11,500 mark for the first time since late January, as media reports revealed that new code, finally featuring full SegWit (Segregated Witness), will be unveiled in the next few days. The SegWit upgrade will allow administrators to separate signature data from transactions, unlocking more space to add additional transactions to the blockchain.
Bitcoin has since fallen, to $11,200, on newer cryptocurrency developments: BoE Governor Mark Carney told students at London Regent’s University that Bitcoin failed two tests toward becoming an actual currency—it's neither a medium of exchange nor a store of value.
This follows similar arguments made by analysts at UBS and S&P Global Ratings as well as ECB executive board member Yves Mersch, who called for increasing regulations on cryptocurrencies. Augustin Carstens, general manager at the Bank of International Settlements, where central banks hold their accounts, slammed the alt currency earlier in the month as “a combination of a bubble, a Ponzi scheme and an environmental disaster.”
Technically, the price of Bitcoin reached the top of a falling channel, where supply has been overcoming demand since December.
Up Ahead
-
On Wednesday the Federal Reserve will release minutes from its January 30-31 meeting, Janet Yellen’s last as chair, where officials left interest rates unchanged.
-
Fed policy makers speaking this week include New York Fed President William Dudley and Atlanta Fed President Raphael Bostic. Cleveland Fed President Loretta Mester is among speakers at the U.S. Monetary Policy Forum in New York City.
Earnings Reports
-
Home Depot (NYSE:HD) is schedule to release earnings before market open, for the fiscal quarter ending January, with an EPS forecast of $1.62, versus $1.44 YoY.
-
Wal-Mart Stores (NYSE:WMT) is expected report earnings results before market open for the fiscal quarter ending January, with a $1.36 EPS forecast vs $1.3 YoY. The strengthening economy brought out shoppers during the November-December holidays, increasing retail sales by 5.5 percent YoY, to about $692 billion, the largest increase in holiday sales since the 2008 Great Recession. Will those numbers impact the world’s largest company by revenue?
Market Moves
Stocks
-
The STOXX Europe 600 Index climbed 0.2 percent.
-
Futures on the S&P 500 Index dropped by 0.3 percent, in the first retreat in more than a week.
-
The MSCI Asia Pacific Index sank 0.8 percent, the first drop in more than a week.
-
The UK’s FTSE 100 Index was little changed.
-
The MSCI Emerging Markets Index fell 0.5 percent, the biggest decline in more than a week.
Currencies
-
The US dollar Index climbed 0.43 percent, set for the highest close in a week.
-
The euro declined 0.5 percent to $1.2347, the lowest in more than a week.
-
The British pound dipped 0.5 percent to $1.3934.
-
Japan’s yen sank 0.5 percent to 107.13 per dollar, in the largest decrease in more than two weeks.
-
South Africa’s rand declined 0.6 percent to 11.7365 per dollar.
Bonds
-
The yield on 10-year Treasuries increased five basis points to 2.92 percent, the highest in more than four years.
-
Germany 10-year yield climbed two basis points to 0.76 percent.
-
UK 10-year yield rose two basis points to 1.622 percent.
Commodities
-
WTI crude climbed 0.8 percent to $62.19 a barrel, the highest level in two weeks.
-
Gold sank 0.7 percent to $1,337.02 an ounce, the biggest dip in two weeks.
