US stocks on track to move higher, for a fifth day, against rising yields on weakest retail sales in 11 months
TOPIX bounces off 4-month low, despite strongest yen in 15 months
Dollar traders remain pessimistic, focusing on twin deficits instead of rising inflation
USD/JPY exchange rate decoupling from US interest rates raises red flag for dollar bulls
10-year Treasurys yields continue to climb toward 3-percent key level
Oil climbs above $60 for a second day, but shows signs of weakness
Gold set to push to higher peak, confirming uptrend
Lunar New Year celebrations for the Year of the Dog begin, affecting business hours in China, Hong Kong, Taiwan, Singapore, Malaysia and Indonesia. Chinese mainland markets are closed February 15-21.
Earnings:
Consolidated Edison (NYSE:ED), which ranks among the largest US investor-owned energy-delivery companies with $12 billion in annual revenues and $49 billion in assets, is scheduled to report its earnings for the fiscal quarter ending December 2017 after market close. The EPS consensus is $0.78 vs $0.69 YoY.
The STOXX Europe 600 Index climbed 0.5, the biggest gain in more than a week.
Germany’s DAX gained 0.7 percent, the highest result in more than a week.
The MSCI All-Country World Equity Index increased 0.6 percent to 518.07, hitting the highest level in almost two weeks with a fifth consecutive advance.
The US dollar Index declined more than 0.3 percent to 88.73, paring a 0.45 percent decline to 88.58 but still reaching the lowest level in two weeks on a fourth straight decline.
The euro climbed 0.3 percent to $1.2492, hitting the strongest in two weeks with its fifth straight advance.
The Japanese yen jumped 0.6 percent to 106.40 per dollar, the strongest in about 15 months.
The British pound gained 0.4 percent to $1.4048.
South Africa’s rand advanced 0.5 percent to 11.6629 per dollar.
The yield on US 10-year Treasurys increased three basis points to 2.93 percent, the highest level in more than four years.
Germany’s 10-year yield gained one basis point to 0.77 percent, the highest level in more than two years on the biggest gain in a week.
West Texas Intermediate crude gained 1.1 percent to $61.26 a barrel, the highest in more than a week.
Gold increased 0.3 percent to $1,354.27 an ounce, the highest in more than three weeks.
Copper climbed 0.1 percent to $3.24 a pound, the highest in six weeks.
Key Events
Yesterday, all four major US indexes—the S&P 500 Index, the Dow Jones Industrial Average, the NASDAQ Composite and the Russell 2000—extended their rebounds to a fourth day, even as Treasury yields climbed to a four-year high, after consumer price data increased bets the Federal Reserve will accelerate its tightening cycle.
The S&P 500 Index advanced 1.34 percent, led by Financials, which bagged a 2.38 percent gain since expected higher rates would benefit bank earnings. Utilities underperformed, suggesting investors were rotating back out of defensive stocks and into growth equities. The Real Estate sector also lost 0.63 percent in value, as traders cashed out after shares outperformed in Wednesday's session with a 0.73 percent rise. The SPX is now back to positive territory year-to-date, up 0.95 percent, after tumbling 11.8 percent from its January 26 peak.
The Dow is up 1.04 percent after yesterday's trade, higher by 0.8 percent for the year, reversing its harsh 12.25 percent slump from the index's January 26 high.
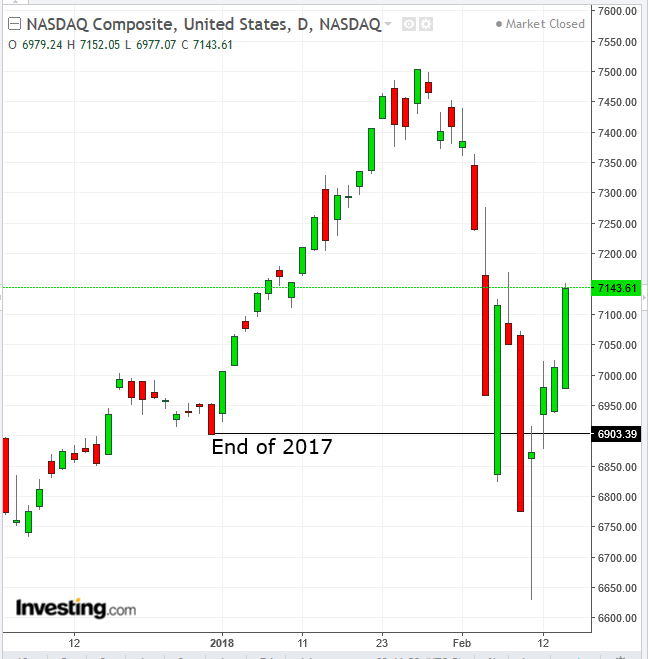
The NASDAQ Composite was the leader of the pack, jumping 1.85 percent. The tech-heavy index also outperformed peers on a year-to-date basis as it returned to a positive 3.5 percent after falling 11.5 percent from its January 26 peak.
The Russell 2000, while coming in as the second-best performer yesterday with a 1.75 percent jump, is underperforming for the year so far and holds the dubious honor of being the only major US index still down for the year, 0.85 percent in the red.
January's employment report showed that wage growth increased 2.9 percent YoY, the fastest pace since 2009. Wage growth is a leading indicator for the overall inflationary trend, as companies tend to raise prices to consumers to cover added labor costs. Higher prices raise inflationary pressure and thus the likelihood that the Fed hikes interest rates as a counter measure. Higher interest rates would in turn boost the cost of borrowing, making it more difficult to support record-high equity prices.
In other words, stocks fell, because the economy is strong and is able to support higher interest rates. As such, all eyes were glued to yesterday’s CPI figures, to gauge whether they would confirm the faster economic growth trend highlighted by January's wage growth reading.
Indeed consumer prices jumped 0.5 percent MoM, beating analysts' 0.3 percent estimate. Initially, stock prices fell. However, equity markets closed higher. Why? How is that possible?
It was the second set of US data investors received, projecting higher inflation, that—ironically—propelled stocks higher on the day. Retail sales decreased 0.3 percent, missing a 0.2 growth forecast and posting the biggest decline in 11 months, as households cut back on motor vehicles and building materials. The underwhelming figure raised questions over the strength of the economic growth trend.
In textbook economics and stock analysis, the market is a leading indicator for the broader economy. The overall intelligence of smart money is ahead of the curve when it comes to economic turns. In other words, company earnings are dependent upon the nurturing environment of a healthy economy.
However, investors are conditioned human beings. They have been spoiled by unprecedented accommodative monetary policy by the Federal Reserve, which seems to have led investors to no longer care about the state of the economy. Rather, investors have grown used to focusing squarely on the bottom line of company earnings. So much so that they bet a strong economy would hurt corporate earnings, a bet that was enough to prompt the worst two-week equity selloff in two years.
Conversely, when they read that retail sales experienced their weakest month in nearly a year, they gather that companies will profit, pushing them to extend the current stock market rebound into a fourth day.
Meanwhile, new Fed Chairman Jerome Powell suggested on Tuesday that the Federal Open Market Committee would forge ahead with gradual tightening even as it keeps an eye on financial-system risks following the recent equity rout.
Global Financial Affairs
This morning, global equity markets extended their rebound, starting from the Asian session. Even shares in Tokyo rose for the first time in four days, with the TOPIX index bouncing off a four-month low, even as the yen continued climbing after hitting a 15-month high yesterday. Until Wednesday, the stronger yen forced Japanese shares to buck the trend and miss out on a powerful rebound, as a stronger currency hurts exports and renders stock prices more expensive after going through the exchange rate. But the fact that Japanese shares could rise forcefully against such a powerful yen underscores investor bullishness; they are betting that stocks will rise even against weaker exports.
Stocks advanced in Australia as the S&P/ASX 200 Futures Index climbed. Hong Kong equities on the Hang Seng finished their best three-day run in more than two years in shortened trading ahead of the Lunar New Year holiday.
The STOXX Europe 600 Index followed in the footsteps of Asian indices, advancing for a second day. S&P 500 Futures suggest US stocks will open higher.
Bond traders increased their expectations for the number of Federal Reserve interest-rate hikes to four by the end of next year after a report showed US consumer prices rose more than projected in January. The inflation figures gave little comfort to dollar bulls, who are instead focusing on the US twin deficits – the national economy’s current account balance and the government budget balance, giving rise to debate among investors and traders on the breakdown in market correlations.
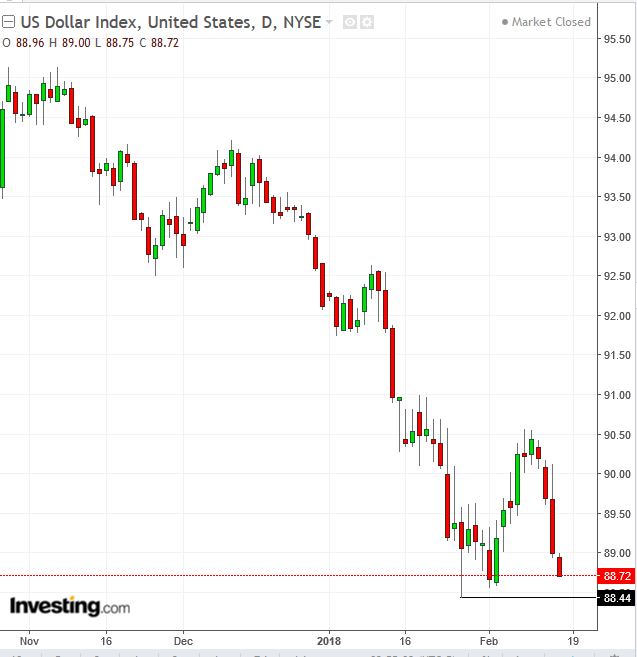
Yesterday, the dollar Index slipped 0.3 percent to 88.879 after losing more than 0.6 percent overnight despite the strong CPI inflation numbers.
The recovery in broader risk sentiment was seen weighing on the dollar, which had gained during the market turmoil earlier in the month. The US currency has been weighed down by a variety of factors this year, including concerns that Washington might pursue a weak dollar strategy and the perceived erosion of its yield advantage as other countries start to scale back their easier monetary policy.
Technically, the USD price is nearing its January 26, 88.44 trough. A lower price would signal a resumption of the downtrend. It is interesting to note that the lowest price for the dollar index since December 2014 coincided with the highest price for equities, before the selloff.
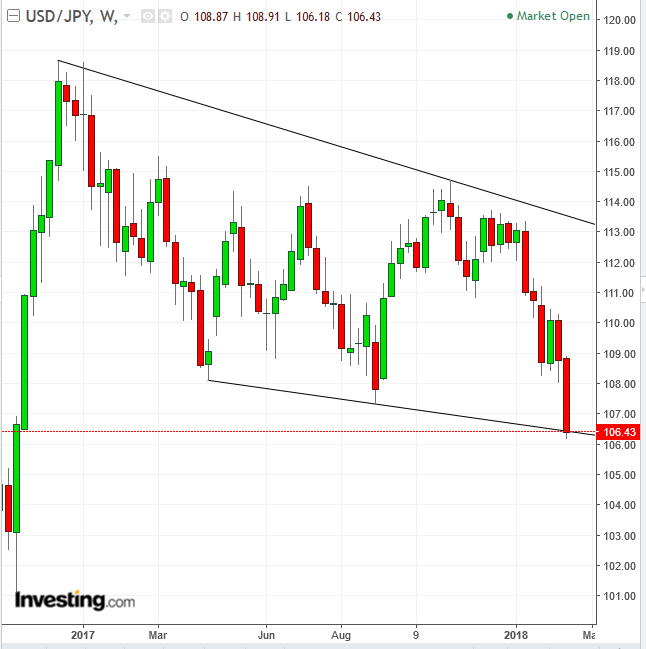
Exante Data's founder and CEO Jens Nordvig said in an interview with Bloomberg that there’s a "very profound" disruption of long-standing correlations behind the moves seen in the dollar-yen. "The FX market has been very surprised by some of the breakdowns in correlations we’ve seen," he noted, adding that the USD/JPY exchange rate decoupled from US interest rates. “The really big story is that the dollar is tanking.”
Comments by Japan's Deputy Prime Minister and Finance Minister Taro Aso that the yen’s strength is not marked enough to intervene, supported the Japanese currency’s rally into a fourth day, as the dollar deepened its descent against all major peers.
Technically, the USD/JPY price has dipped below and bounced back above the bottom of a falling channel since December 2016. After a 6 percent decline this year, it may be ripe for an upward correction within the downtrend.
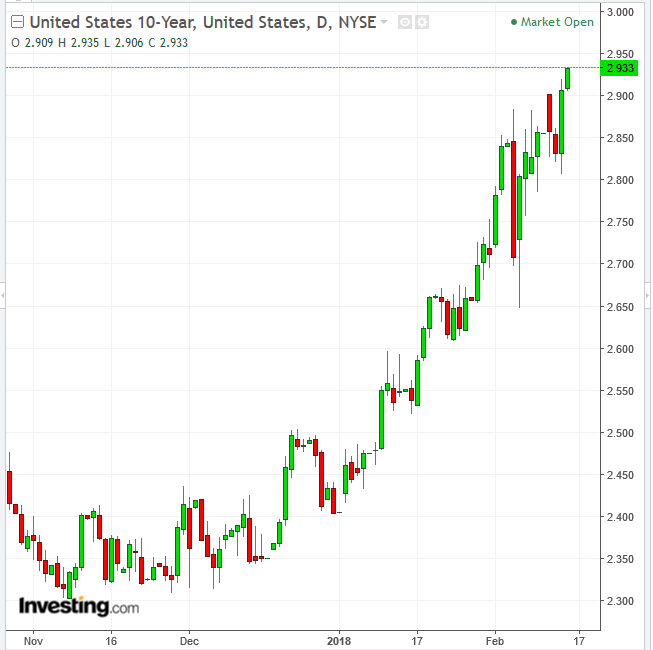
The yield on US 10-year Treasurys kept chugging closer to 3 percent, reaching 2.93, continuing its steady advance from last year’s low of 2.01 percent in early September.
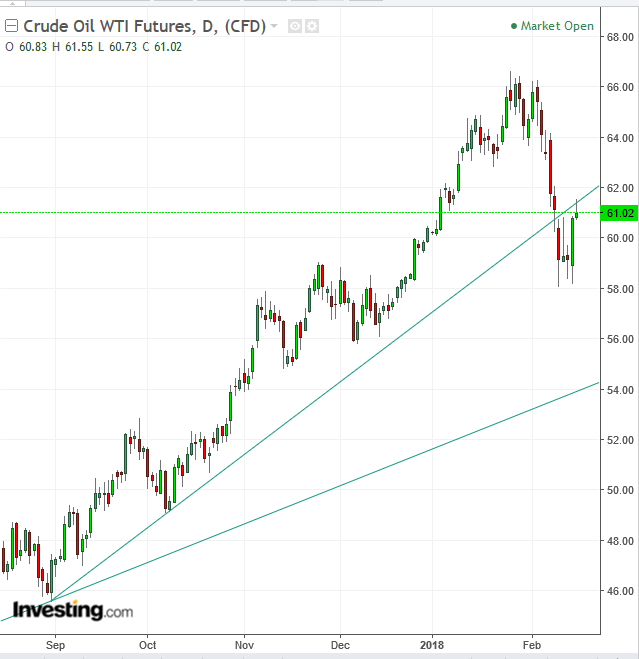
Metals gained on the dollar’s weakness and oil benefited from the comeback of risk appetite. Technically, WTI's price peaked above its broken uptrend line since August 31 and shifted back down.
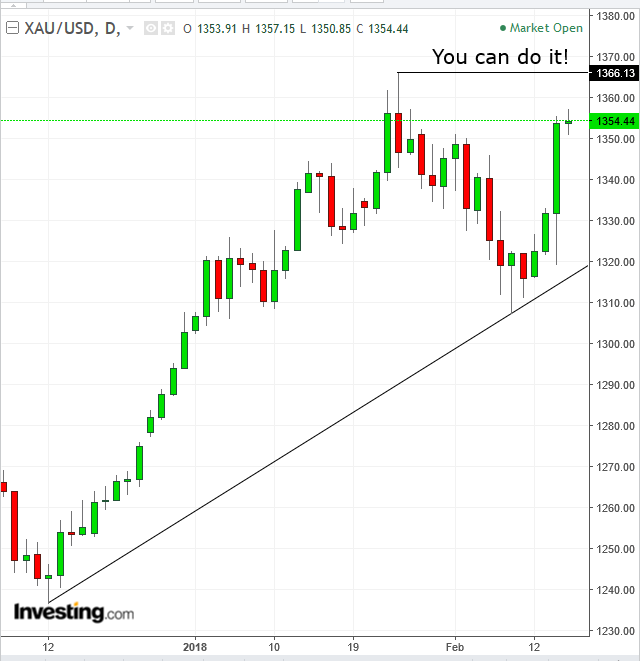
Gold extended a rally to a fourth day, nearing its January 25, $1,366.13 peak. A higher price would signal a resumption of the uptrend.
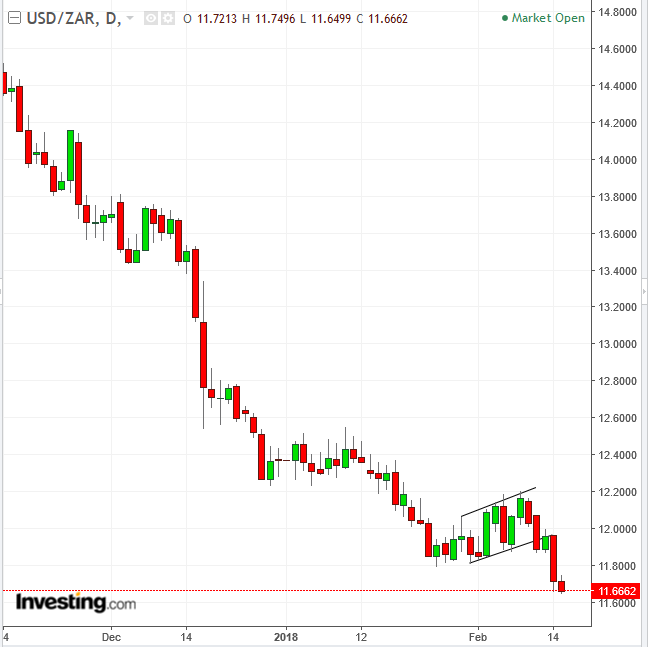
South Africa’s rand traded near a three-year high after President Jacob Zuma stepped down on escalated government pressure. Technically, the USD/ZAR pair confirmed the completion of a continuation pattern by the name of Rising Flag, bearish within a downtrend, aided both by a strong rand on the political development and a weak dollar.
Up Ahead
Market Moves
Stocks
Currencies
Bonds
Commodities
