- Global stocks, U.S. futures slip as Trump resumes trade offensive on China
- Apple bucks falling stock on reassurance of production capabilities outside China
- Yields drop as safe-havens climb on risk-off
- Oil tumbles on dismal outlook of low demand and oversupplied market
- Monthly consumer price index figures, a key measure of U.S. inflation, are due on Wednesday.
- The race to pick a successor to British Prime Minister Theresa May heats up on Thursday, with the first Conservative Party leadership ballot.
- Also on Thursday, euro-area finance ministers meet in Luxembourg. On the agenda: financial penalties for Italy over its debt load and the euro-area budget.
- U.S. Industrial production and retail sales data on comes out on Friday
- China also releases factory output and retail sales on Friday.
- Hong Kong’s Hang Seng Index dropped 1.9%, in the largest tumble in almost five weeks.
- The MSCI Emerging Market Index slid 0.5%, the biggest drop in almost three weeks.
- The Dollar Index slipped 0.08% for the second day and a total of 0.16%.
- The Japanese yen gained 0.2%.
- The Hong Kong dollar climbed 0.2% to 7.8246 per U.S. dollar.
- The MSCI Emerging Markets Currency Index dropped less than 0.05%.
- The yield on 10-year Treasurys declined two basis points to 2.13%.
- Britain’s 10-year yield fell two basis points to 0.838%.
- Germany’s 10-year yield slid one basis point to -0.24%.
Key Events
Futures on the S&P 500, Dow and NASDAQ 100 tracked global stocks lower as the U.S. turned its trade tariff salvos from Mexico—which boosted the rally triggered by a dovish Fed compounded by weak economic data—back to China.
The STOXX 600 opened lower, threatening to end a three-day winning streak and seven sessions out of eight of sealing gains.
In the earlier Asian session, Hong Kong’s Hang Seng (-1.94%) underperformed, falling back below the 200 DMA after scaling above it for the first time since Jan. 31, amid mass protests against an extradition bill that would allow people to be sent to mainland China for trial.
Nevertheless, the Hong Kong dollar climbed to the strongest level since December amid signs of tightening funding costs. While the HKD completed a double-top, its technical signals are questionable as the currency is not allowed to trade freely, as it’s controlled by the Hong Kong Monetary Authority. Despite being the third most active currency in Asia—and the eighth most traded currency in the forex marketplace—the HKD is not a major reserve currency.
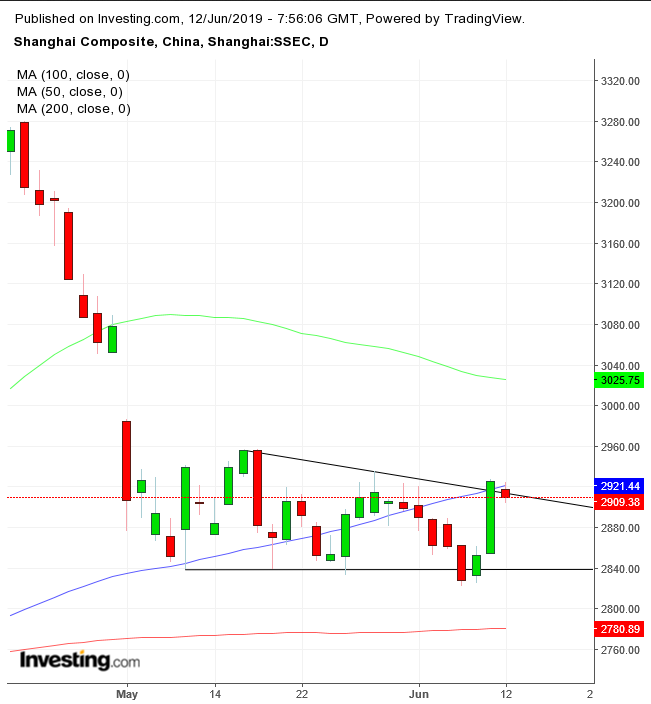
With renewed threats of U.S. tariffs hanging over the country, China’s Shanghai Composite (-0.56%) fared as the region’s second worst performer. After jumping 2.5% on Tuesday — on the government’s stated commitment to ramp up stimulus to offset the trade war’s adverse effects on its market—and closing near the top of the session, the index opened lower today and then extended the decline. Technically, it traded according to its descending triangle, after finding a dual resistance by the 100 DMA and the top of the triangle, where supply overcomes demand.
Global Financial Affairs
On Tuesday, U.S. shares closed flat to slightly lower. What traders should pay attention to is bulls’ disappointment measured by how many stocks slipped from their opening prices on the protracted euphoria of averting a trade war with Mexico.
The S&P 500 closed only mildly in the red (-0.03%), but it gave up a 0.7% higher open. The Dow may have only backtracked 0.05%, but that was after giving back a 0.5% higher open. The NASDAQ Composite is the best example of yesterday's dynamic. While it closed virtually flat, slipping a mere 0.01%, traders watched a 1.00 % higher open slip between their fingers. While the Russell 2000 (-0.32%) underperformed, ironically, it may have cost traders the least, opening only 0.1% higher, therefore actually outperforming relative to its opening price.
From a technical perspective, we have received another layer of confirmation of the available supply at these levels after all the main U.S. indices attempted to—but ultimately failed to—break through the resistance of their respective shooting stars.
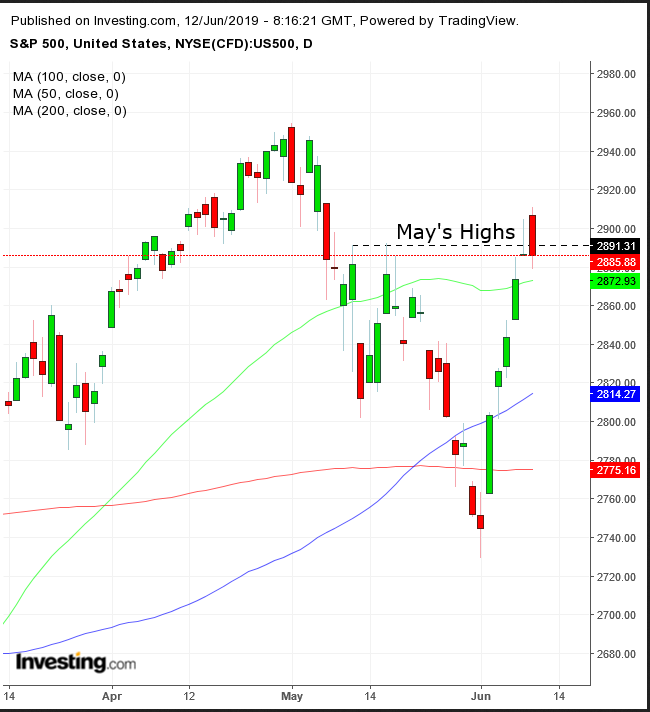
While the S&P 500 didn’t complete an evening star, whose potential we discussed yesterday, it did complete a bearish engulfing pattern, as it closed below the real body, confirming Monday’s shooting star, which in turn reinforced May’s highs. Having said that, the last two sessions did produce higher highs, erasing May’s peak as part of a descending peak-trough formation, required for a downtrend.
However, prices are still lower than the May 1 peak record, which means that, if prices fall from here, yesterday’s high would be considered a second low from the May peak, according to a more lenient interpretation. A stricter analyst would require two descending peaks and troughs that weren’t part of the uptrend. Therefore, if prices do take out the June 3 low, a purist would only have one lower peak-trough formation and would require another set to call a downtrend.
Industrials (-0.86) weighed down on the SPX as trade war rhetoric turned ugly again. U.S. President Donald Trump threatened China President Xi Jinping with “much higher than 25%” tariffs on $300 billion of Chinese goods, to be enacted immediately.
Throughout the trade dispute, since it first roiled global markets last March, China has tried to respond in a balanced way to the U.S. tariff offensives. While the Asian nation has a lot more to lose than the U.S., it’s doubtful it will openly capitulate. On the other hand, Trump must know this. Therefore, after the tough talk, we expect the president to give Chinese negotiators a way out of this impasse while still saving face.
We can expect rhetoric to impact market moves at least until the G-20 summit, scheduled for June 28-29 in Osaka, Japan. Will the two presidents meet and come to any agreement on the occasion?
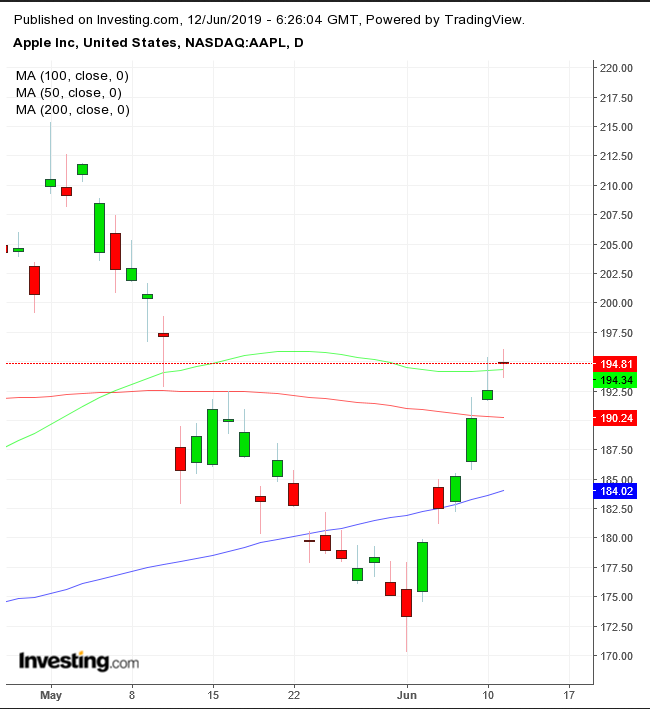
Meanwhile, Apple (NASDAQ:AAPL) jumped 1.16% against a declining market, after its main assembler, Foxconn, revealed it would be able to manufacture iPhones for the U.S. outside China.
However, from a technical perspective, the stock may be due for a correction, after forming a high wave candle—showing a lack of direction, bearish after a rally—beneath the resistance of the shooting star formed Monday.
Overall, investors back-pedaled into safe-haven assets, pushing yields on 10-year bonds toward the bottom of a rising flag, bullish—upon a downward breakout—following the drop from below 2.45% to scraping the 2.00% level in just under two weeks.
As traders have added bets on lower U.S. interest rates, Trump stepped up his criticism of Fed policy on Tuesday, calling borrowing costs “way too high” amid “very low inflation.”
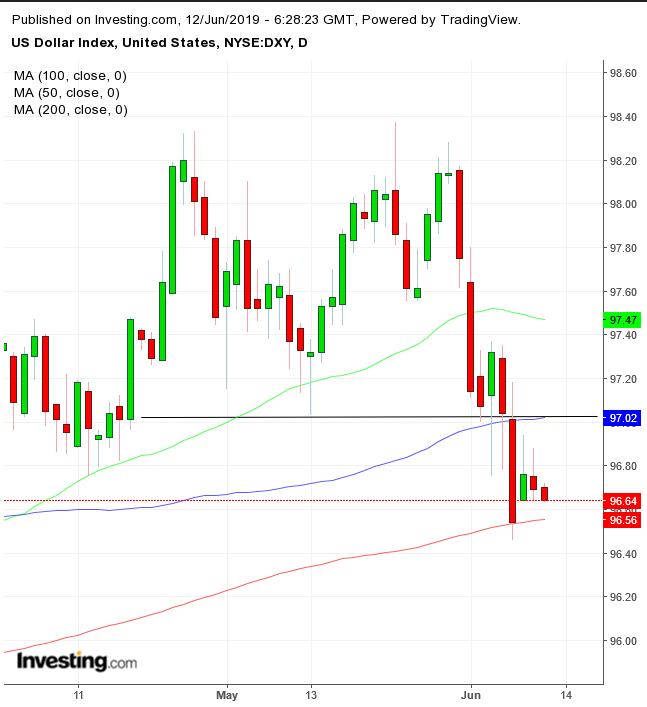
The dollar has been squeezed between the 100 and 200 DMA after completing a double-top. A close below the 200 DMA would signal the decline will resume.
On the other side of the Atlantic, traders seem to be happy about a change of leadership—ahead of Thursday's first ballot to select Theresa May's successor as prime minister—as the price of the pound is up 1.3% from the low of May’s end. A close above 1.2750 would complete a small H&S pattern, suggesting a continued rally for the British currency.
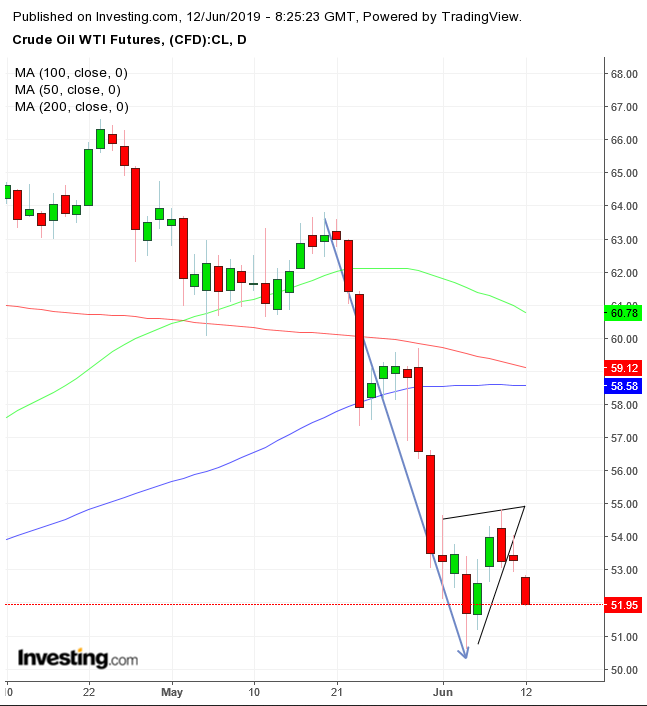
Oil slid lower for a second day, toward $52 a barrel, as ongoing trade wars and widespread signs of a contracting global economy depressed demand. The EIA cut its forecast for the year by 160,000 barrels per day, to 1.22 million bpd, and scaled back its forecast for 2019 U.S. crude production to 12.32 million bpd—both on declining world oil demand and U.S. production. Some analysts pointed out that Iran's positioning towards the U.S. as well as OPEC allies is also keeping the market under pressure. WTI may have completed a pennant, a continuation pattern, suggesting prices will continue to fall below $50.
Up Ahead
Market Moves
Stocks
Currencies
Bonds
Commodities
