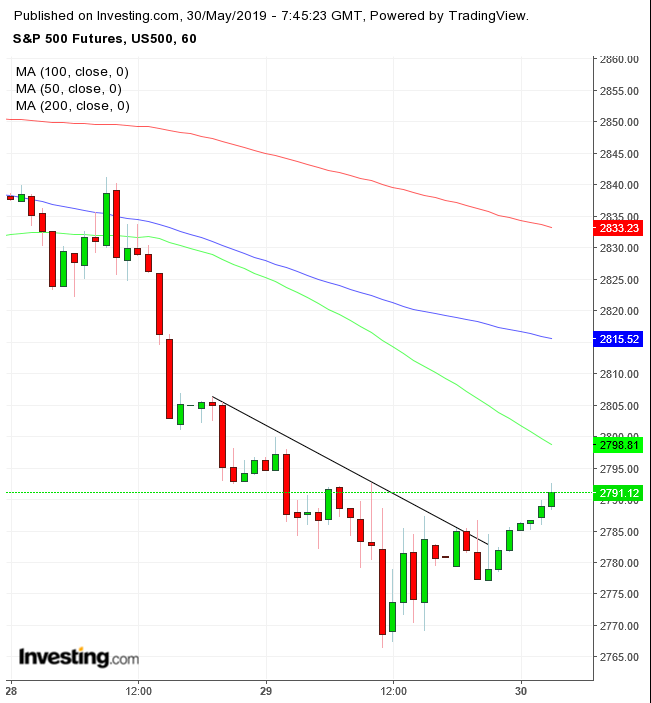
- U.S. futures, European shares rebound; Asian stocks take a hit from fresh trade salvos
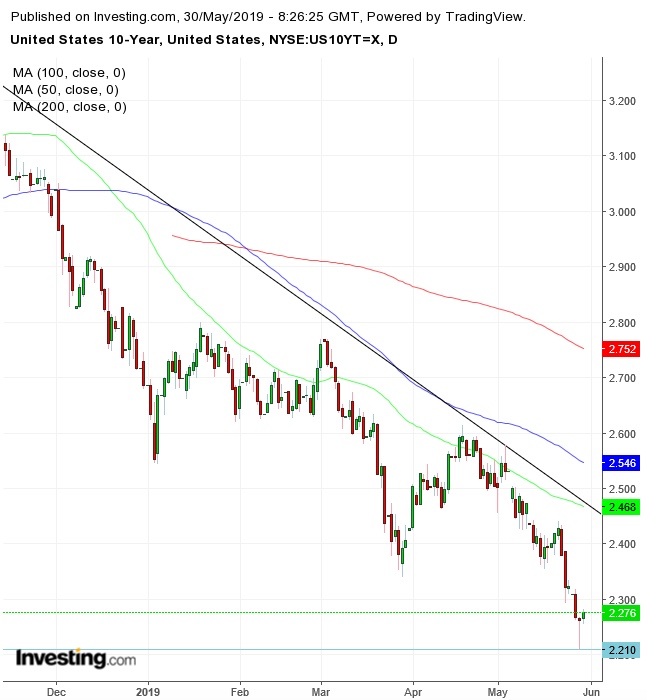
- Yields pare losses, curve inversion eases after sending key recession signal
- U.S. indices top out; utilities underperform
- Revised first-quarter GDP numbers are due in the U.S. on Thursday.
- Also on Thursday, U.S. data including personal income and spending and initial jobless claims will provide more clues on the outlook for the world’s biggest economy and the Fed’s monetary policy path.
- China provides figures on its May economic performance on Friday, with economists anticipating the official manufacturing PMI will tick down to 49.9 and signal a contraction amid the worsening trade war with the U.S.
- The MSCI Emerging Market Index gained 0.7%, the highest in more than a week on the biggest increase in eight weeks.
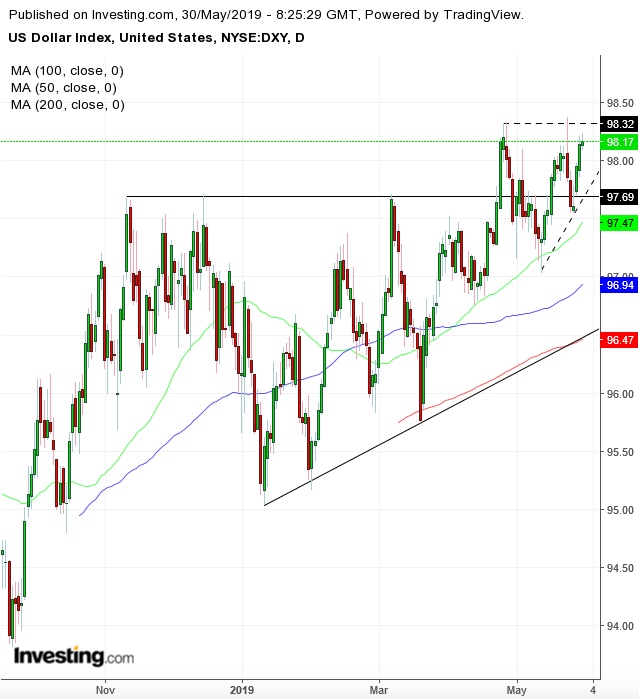
- The Dollar Index rose 0.04%, after an intraday 0.09% advance to a yearly high.
- The euro gained less than 0.05% to $1.1133.
- The British pound climbed 0.1% to $1.2634.
- The onshore yuan increased 0.1% to 6.905 per dollar.
- The yield on 10-year Treasurys edged two basis points higher to 2.28%, the largest climb in more than a week.
- The yield on 2-year Treasurys rose two basis points to 2.13%.
- Germany’s 10-year yield climbed two basis points to -0.16%, the largest increase in a month.
- Japan’s 10-year yield gained one basis point to -0.077%, the biggest surge in six weeks.
Key Events
Equities in Europe followed U.S. futures higher this morning, against a falling Asian session, as Treasury yields pared losses after dipping to the lowest level in 20 months on Wednesday—deepening a key component of the yield curve that historically heralds a recession 18 months down the line.

Contracts on the S&P 500, Dow, Russell 2000 and NASDAQ 100 climbed for seven straight hours—though the presumed bearish counterforce within a downtrend suggests this is merely a technical pullback, rather than a bottom.
The STOXX 600 advanced, with energy companies tracking oil prices, which also edged higher for seven hours this morning. The pan-European gauge is climbing back above the neckline of a H&S top after closing slightly below it yesterday. The European oil benchmark, however—Brent Crude—has hit resistance levels from Tuesday and is set to form its first red candle of the current rally.
In the earlier Asian session, most regional indices tracked yesterday’s U.S. decline as the U.S.-China trade war intensified, with high-level Chinese officials accusing the U.S. of "naked economic terrorism." The trade-led selloff finally caught up with Hong Kong's Hang Seng (-0.44%), China’s Shanghai Composite (-0.30%) and Japan's Nikkei 225 (0.29%), while South Korea’s KOSPI (+0.77%) was the only major benchmark to close in the green, as bargain hunters bought a dip that reached 10% since mid April.
Global Financial Affairs
On Wednesday, U.S. equities slipped to a 12-week low.
The S&P 500 extended its decline by 0.69%, with all sectors but Materials (+0.02%)—which barely managed to cling onto gains—closing in the red. It’s ironic that the most export-reliant sector outperformed amid a worsening trade outlook—though the basic materials sector should not be confused with what would be at the heart of China’s threat to withhold rare earth metals. Perhaps, in the panic of the herd, investors bid up the sector simply because of its name.
It's even more noteworthy that defensive stocks in Utilities (-1.33%) underperformed for the second day in a row, instead of outperforming on risk-off. Moreover, the recent shift in the interest rate outlook, from hiking to pausing or even cutting rates, means falling yields become less attractive, and should thereby push conservative investors into bond-proxy sectors like this.
Perhaps, however, investors expect yields to keep falling so they rush to grab what they consider a bargain at the current rates. Another explanation may be that the sector’s underperformance is driven by profit-taking, after it hit an all-time high on Friday. Technically, the price fell back into a declining range after breaking to the topside two weeks ago.
Overall, the SPX crossed below the 200 DMA—as did the NASDAQ Composite—stressing the importance of the trendline. However, the price bounced back—for both indices—demonstrating enough traders defended the milestone to push it back up, a bullish signal.
In doing so, the S&P 500 formed a hammer, another bullish sign. Having said that, the benchmark still closed below the 2,800 level, a support and resistance level, whose violation suggests bears outweighed bulls as it completed a H&S. Therefore, while we expect a pickup after the recent selloff, projected in these technical indicators, the medium-term trend has likely reversed, which makes it a short-lived climb. Still, considering its penetration is less than 1.5%, investors should beware of a bear trap.
The Dow Jones Industrial Average tumbled 0.87%, also completing a H&S top, as well as closing well below the 200 DMA, after having completed a bearish pennant, finished off with a falling breakaway gap. The price, however, closed off its lows, showing some support, which might turn into a return move.
The NASDAQ dropped 0.79%, extending the penetration to its H&S top. The tech-heavy gauge also found support by the 200 DMA, as well as the 7,500 round psychological level.
The Russell 2000 gave up 0.82%. We have talked a lot about the market structure inconsistency of small-cap shares sliding rather than surging on a dismal trade outlook and a strengthening dollar, which should favor stocks of domestic companies that don't rely on foreign markets for growth. However, we consider that this small-cap selloff may be typical of a market top, when investors first dump speculative stocks, while still holding on to more conservative portfolios. Meanwhile, from a technical perspective, the index completed a double-top.
Note of Caution: While all four major U.S. indices topped out, it’s not uncommon for a pattern to reverse, or at least whipsaw—even heavily. Therefore, we urge even aggressive traders to be prudent, using both price- and time-filters to reduce the odds of bear traps.

Meanwhile, the yield on 10-year Treasurys closed at 2.262 yesterday after hitting 2.21, the lowest level since Sep. 15, 2017. The move formed a powerful hammer due to its unusually long lower shadow, reeling in Treasury buyers who were perhaps too late for the party.
Wednesday’s trading pattern gives a good visual on how closely linked Treasurys and equities are. The SPX and the NASDAQ both formed hammers, and the Dow and Russell began to pare losses at the same time as Treasury yields did, as investors backpedaled into stocks.
While the hammer in yields suggest a bounce—in mirror image of that in equities—it is expected to be temporary, at least from a technical perspective, as trading mechanisms and market psychology exacerbate crowd psychology. Not only did 10-year yields plunge as investors rotated out of risk assets into safe haven securities, this added another layer of pessimism on growth.
Their inverted curve to 3-month Treasury bills widened to the deepest level since 2007, before the 2008 crash. Many investors and economists believe the yield curve is sending a warning about economic growth in the United States and the world. Under normal market conditions, those who buy debt from the U.S. government over longer maturities are compensated with better interest rates than those who loan money shorter-term.

The greenback climbed for a third consecutive day to over a month high, and less than 0.05% from a year high. Technically, the Dollar Index is forming a secondary, one-month long ascending triangle, after completing a five-month triangle.
Oil rebounded after the release of an industry report showing a much bigger-than-expected drop in U.S. crude stockpiles. Technically, the price found resistance by Tuesday’s high and the 200 DMA. Some analysts though are pointing out that drivers may be shifting more heavily to the negative side, as signs of global economic slowdown strengthen.
Up Ahead
Market Moves
Stocks
Currencies
Bonds
Commodities
