- U.S. futures shrug off Fed disappointment
- European shares lag behind
- S&P 500 drops the most in 6 weeks
- Oil slips after inventories jump to multi-year highs
Key Events
Futures on the S&P 500, Dow and NASDAQ 100 rebounded this morning, as investors attempted to gather a cohesive trading strategy amid disappointing signals from the Fed's monetary policy meeting, some promising corporate earnings reports and hopes for an upcoming trade resolution from ongoing U.S.-China negotiations.
Conversely, Europe's STOXX 600 lingered in the red after a lower open, with both the RSI and the MACD triggering sell signals, taking its cue from the worst Wall Street session in many weeks—which in turn followed signs, on Wednesday, the Fed will steer clear of any policy easing.
Corporate results were mixed, with oil giant Shell (LON:RDSa) beating estimates and Lloyds (LON:LLOY) missing.

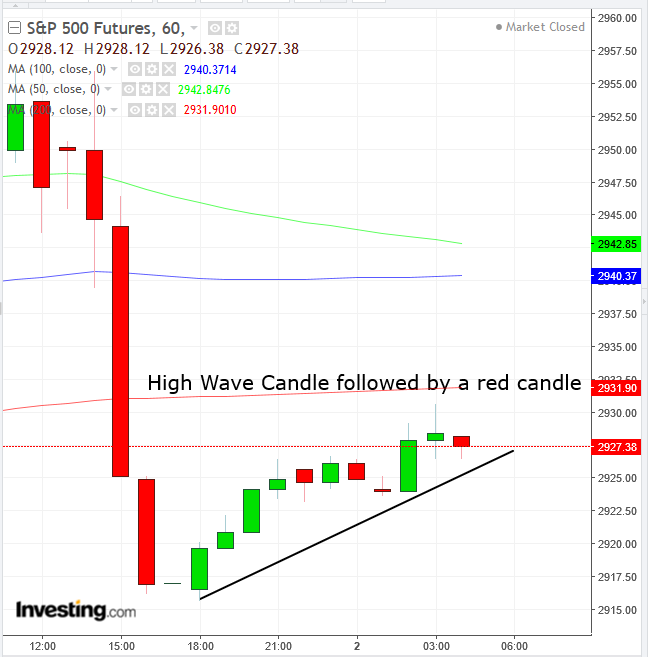
SPX futures contracts started higher but showed signs of weakening after a strong hourly performance 2:00 EDT—to finally bounce back by late European morning.
In the earlier Asian session, trading volumes remained subdued due to holidays in China and Japan, the two biggest regional economies. Investors nonetheless took advantage of a CNBC report that the U.S. and China could announce a trade deal as soon as Friday.
Hong Kong's Hang Seng climbed 0.73% and South Korea's KOSPI gained 0.42%.
Global Financial Affairs
Yesterday, U.S. equities slipped off an Apple (NASDAQ:AAPL)-led rally as investors focused on monetary policy direction, shunning the improved economic outlook that informed it—with a Goldilocks economy picture emerging from signs of a tightening labor market and moderate inflation. Fickle investors, who had quickly piled up stocks on Apple’s positive outlook, just as quickly dumped shares upon the realization that upbeat economic and earnings readings would mean less accommodation from policymakers.
The S&P 500 fell 0.75% after Fed Chief Jerome Powell's speech, which pointed to inflation near the central bank's 2% target. The index posted its biggest decline in nearly six weeks, with all sectors in the red except for Real Estate), which closed flat. Technically, the SPX wiped out three and a half days of gains, with both the MACD and the RSI providing sell signals.
The Dow Jones Industrial Average slid 0.61%. Home Depot (NYSE:HD) (-4.90%) underperformed after outpacing the broader market, as the price of the consumer discretionary stock returns to the bottom of an ascending channel. On the other side of the spectrum, Apple continued to outperform (+4.91%) .
The NASDAQ Composite retreated 0.57%. Technically, the tech-heavy index dropped to a seven-session low, with both the MACD and the RSI providing sell signals, after being stretched by the strong rally since that which followed the late March pause—similarly to the S&P 500.
The Russell 2000 underperformed, ticking 0.9% lower, after recently providing the best returns among U.S. majors.

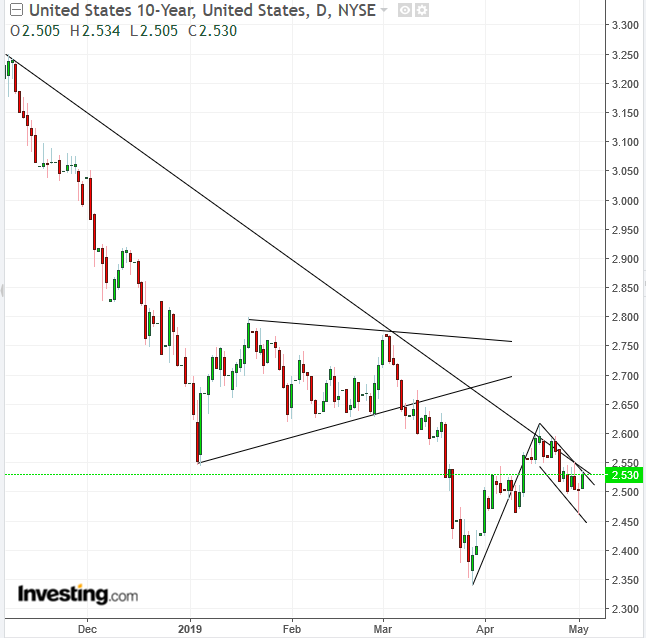
Powell covered all his bases this time, in line with our prediction that he would be extremely cautious in his rhetoric, maintaining a neutral bias. “We don’t see a strong case for moving in either direction," he said, "The economy continues on a healthy path, and the Committee believes that the current stance of policy is appropriate.” Yields on 10-year Treasurys jumped on Powell's words, hitting the top of a potential falling flag, bullish following the April rally, as rate cues clash with the downtrend line since November.

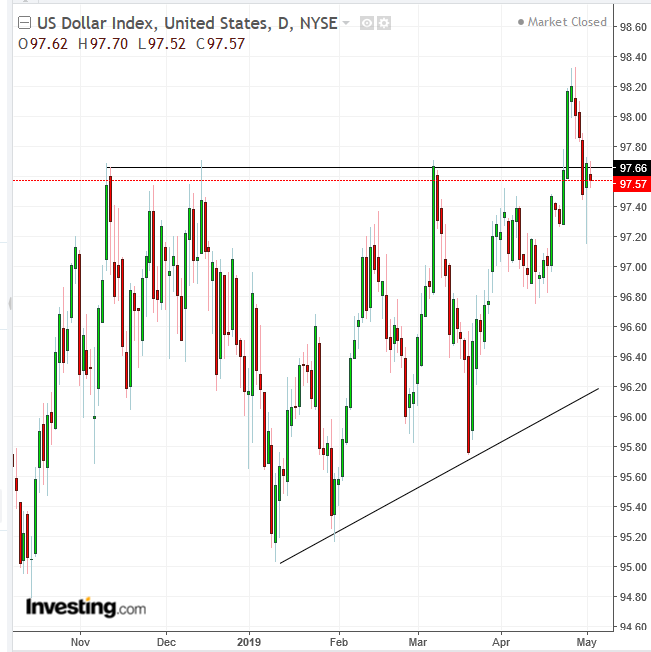
Traders dropped the dollar, which had unwittingly priced in a rate hike. The greenback remains below the top of an ascending channel, projecting the same confusion depicted by yields.

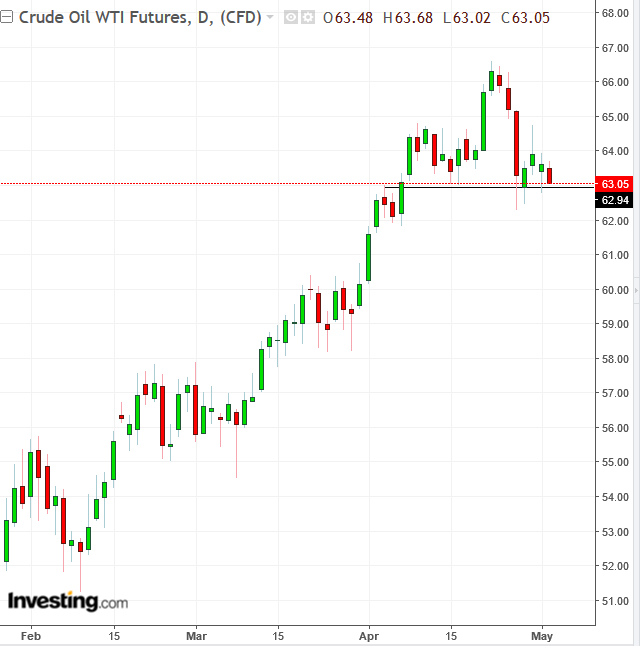
Oil gave up a rebound—also favored by reports of a coup d'etat in Venezuela, which re-ignited fears of a supply shortage—after data showed U.S. stockpiles jumped to the highest level since 2017, even as production in the country reached an all-time high. Technically, WTI was trading according to a H&S top pattern.
Up Ahead
- U.S. Treasury Secretary Steven Mnuchin and U.S. Trade Representative Robert Lighthizer are in Beijing for another round of trade negotiations with Chinese Vice Premier Liu He that will continue next week in Washington D.C.
- The Bank of England sets interest rates and updates its economic forecasts on Thursday, with Governor Mark Carney holding a press conference.
- Data on Friday is expected to show non-farm payrolls rose by 185,000 and unemployment rate grew 3.8% in April. Average hourly earnings growth are forecast to have picked up to 3.3%.
Market Moves
- The U.K.’s FTSE 100 slid 0.4% to the lowest in a month.
- The MSCI Asia Pacific Index declined 0.1%.
- The MSCI Emerging Market Index climbed 0.1%.
Currencies
- The Dollar Index dropped 0.12%.
- The euro edged less than 0.05% lower to $1.1195.
- The British pound gained less than 0.05% to $1.3054, reaching the level strongest in more than two weeks on its fifth consecutive advance.
- The Japanese yen declined 0.1% to 111.53 per dollar, the largest drop in more than a week.
Bonds
- The yield on 10-year Treasurys gained three basis points to 2.53%.
- Germany’s 10-year yield increased one basis point to 0.03%, the highest in more than a week.
- Britain’s 10-year yield gained three basis points to 1.183%, the biggest climb in almost three weeks.
Commodities
- Gold dipped 0.4% to $1,271.81 an ounce, the weakest in more than four months.
- West Texas Intermediate crude declined 0.5% to $63.27 a barrel, the lowest in almost four weeks.
