- Global shares take cues from biggest U.S. stock jump in six weeks
- Treasurys fall on risk-off, weighing on U.S. dollar
- Pounds jumps on EU support for May's deal; later gives in to caution ahead of key Brexit vote
- WTI leaps on OPEC cuts
- The U.K. House of Commons votes on May’s revised Brexit deal today, ahead of the official March 29 departure date.
- Chinese retail sales and industrial production data are scheduled for release on Thursday. The National People’s Congress is set to wrap up with a speech by Premier Li Keqiang on Friday.
- Bank of Japan Governor Haruhiko Kuroda will speak on Friday, after a monetary policy decision.
- Futures on the S&P 500 gained 0.2% to the highest in a week.
- The STOXX 600 ticked 0.2% higher.
- The U.K.’s FTSE 100 fell 0.5% to the lowest in more than a week.
- The MSCI Asia Pacific Index jumped 1.1%, the biggest surge in almost six weeks.
- The MSCI Emerging Market Index climbed 1%.
- The Dollar Index slipped 0.17% to 97.01.
- The euro advanced 0.2% to $1.1268.
- The British pound climbed 0.6% to $1.3226, the strongest in more than a week.
- The Japanese yen slid 0.1% to 111.34 per dollar, the largest fall in a week.
- The yield on 10-year Treasurys advanced two basis points to 2.66%, the biggest rise in more than a week.
- Germany’s 10-year yield increased two basis points to 0.08%, the largest climb in more than a week.
- Britain’s 10-year yield gained four basis points to 1.215%, the biggest increase in almost two weeks.
- Gold edged 0.2% higher to $1,295.94 an ounce.
- West Texas Intermediate crude climbed 0.5% to $57.09 a barrel, the highest in more than a week.
Key Events
Global equities and futures on the S&P 500 and NASDAQ 100 extended a rally this morning after U.S. stocks sealed the biggest advance in six weeks on Monday, helped by a surge in chipmakers shares and by upbeat U.S. retail sales data, which eased concerns over a downturn in the world’s biggest economy.
Future contracts on the Dow remained in negative territory, struggling to overcome the weakness of Boeing (NYSE:BA) shares.
The STOXX 600 jumped, driven by miners and carmakers—two export-sensitive sectors. Considering the current rally has nothing to do with any tangible progress in U.S.-China trade talks, investors are either being overly-optimistic or finding the trade-proxy sectors to be a bargain after last week’s trade-related rout.
Earlier, prices jumped in Asia, riding on the coattails of the best U.S. daily session since January. Last-minute support from the EU for U.K. Prime Minister Theresa May's Brexit deal also helped prices higher, lowering global geopolitical risk head of a crucial Brexit vote at the British Parliament today.
MSCI’s broadest index of Asia-Pacific shares excluding Japan pared some gains to rise 0.9% in the second part of the session, pulled up by energy shares, which tracked a recovery in crude oil prices.
Japan’s Nikkei 225 outperformed its regional peers, surging 1.79%, followed by Hong Kong’s Hang Seng, which leaped 1.46%. The Shanghai Composite sealed a 1.10% climb, paring most of the downward correction that followed its miraculous recovery at the beginning of the year.
Global Financial Affairs
Yesterday, U.S. shares were buoyed by chipmakers' gains after NVIDIA (NASDAQ:NVDA) announced it will buy Israeli networking chipmaker Mellanox (NASDAQ:MLNX). A rebound in January sales also boosted trading.

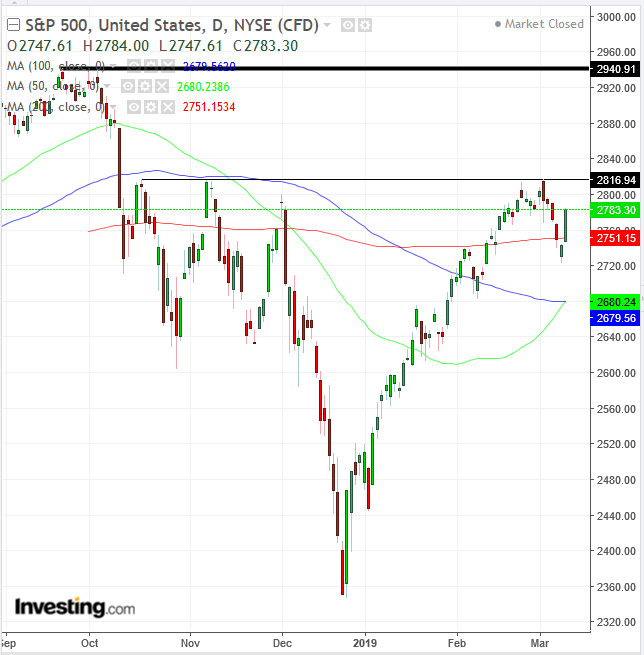
The S&P 500 jumped 1.47%, with all eleven sectors at least 1% in the green and Technology shares (+2.15%) leading the advance. Utilities (+0.71%) stocks lagged. Technically, the index's price climbed back above the 200 DMA, after falling below the key technical signal on Thursday. The 50 DMA realigned with the 100 DMA, demonstrating market indecisiveness as the price eyes the 2,800 resistance since October. As of now, we maintain our view—held since the first half of December—that the post-Christmas rally will have been a correction within a downturn. However, should the Oct. 17 high of 2,816.94 be penetrated, we will reconsider our view, while the Sep. 20, 2,490.91 record-peak represents the final resistance to an ongoing bull market.
The Dow Jones Industrial Average climbed 0.79%, underperforming its U.S. peers after shares of Boeing—its largest component, at 11.26% of total weighting— dropped 5% on Sunday's 737 Max 8 plane crash. The other 29 components of the Dow, however, advanced with the rest of the market. Technically, the index bounced above the 200 DMA, and the 50 DMA crossed above the 100 DMA. The test will be whether the price can overcome the 26,277.82, Nov. 8 peak, which halted the post-Christmas rally when the priced reached that level on Feb. 25, forming a shooting star. As for the S&P 500 though, to extend the medium-term trend the price must post a peak higher than the 26,951.81 record high, registered on Oct. 3.
The Dow Jones Transportation Average (1.94%) ended a 12 straight day selloff, its longest since 1972. Technically, the index bounced off the 100 DMA, after Friday’s hammer found support above the 50 DMA. The importance of the transportation index stems from the fact that it shows whether the goods produced by companies listed on the main Dow index are being sold, thereby providing a litmus test for the latter.
The tech-heavy NASDAQ Composite outperformed, posting a 2.02% jump, boosted by both NDIVIA's deal announcement and signals, from Apple (NASDAQ:AAPL), that it will unveil new upgrades on March 25. As on the SPX, the price jumped back above the 200 DMA, while its 50 DMA scaled above its 100 DMA. The gauge would need to overcome the March 4, 7653.66 high to keep the short-term uptrend going.
The Russell 2000 surged 1.64%, second only to the NASDAQ, reinforcing our view that smart money expects inflation to rise, as we pointed out in yesterday’s post.

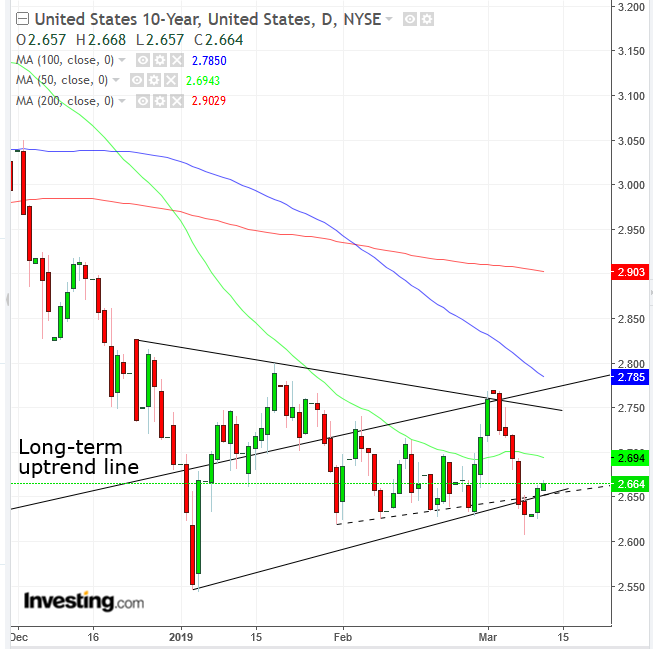
Meanwhile, the yield on 10-year Treasurys extended a climb, most likely thanks to Fed Chief Jerome Powell's remarks, on Sunday's CBS show "60 Minutes," that there will be no recession in the U.S. economy anytime soon. Technically, the rate extended the advance above the resistance of the bottom of the congestion since Jan. 31 (dotted line). Yields have been traded within a symmetrical triangle—which is bearish in a downtrend, especially due to its location, after falling below the long-term uptrend line since the July 2016 bottom.
Waning Treasury demand also means lower demand, from foreign investors, for the U.S. currency—thereby weakening the dollar.

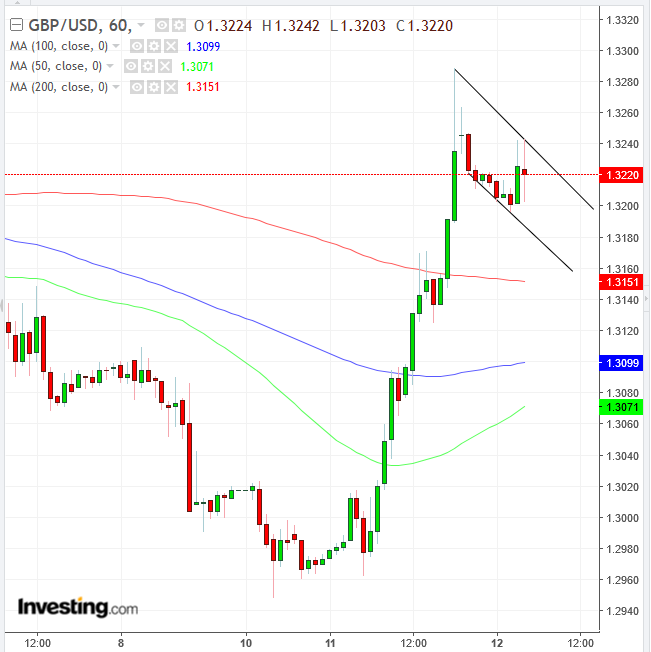
Adding to pressure on the greenback, in the early session the pound strengthened, after support from the EU for May' proposals boosted sentiment. Technically, cable is forming a falling flag on the hourly chart—which is bullish in the GBP uptrend, especially after its vertical advance at 6:00 EDT yesterday. If May wins enough support from Parliament today, that would likely provide a breakout catalyst. However, the British currency gave up earlier gains by late European morning, giving way to caution as the market braced for the possibility of a deadlock in Parliament.

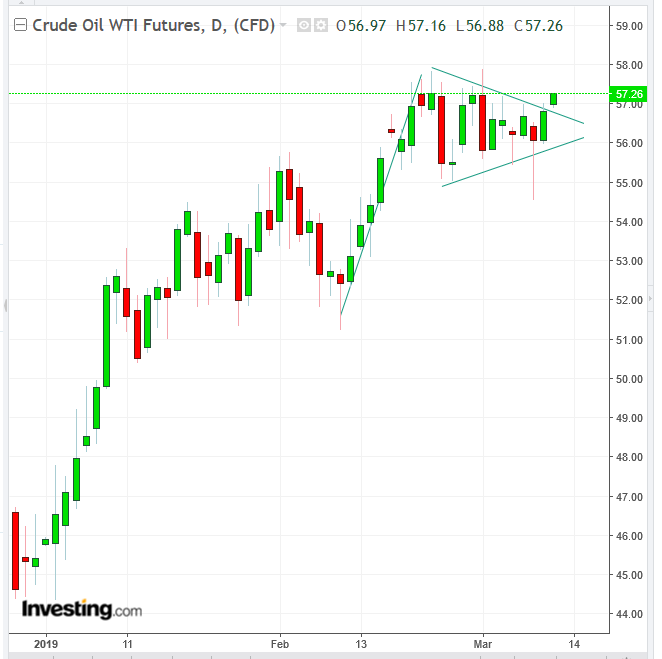
WTI opened higher, climbing for the second day, as OPEC members stood by their supply cuts—a maneuver which is proving to be both a boon and a bane to the oil-producing group. Technically, the price broke to the topside of a pennant, bullish in an uptrend.
Up Ahead
Market Moves
Stocks
Currencies
Bonds
Commodities
