- Global stocks, U.S. futures take a hit from mixed signals on trade
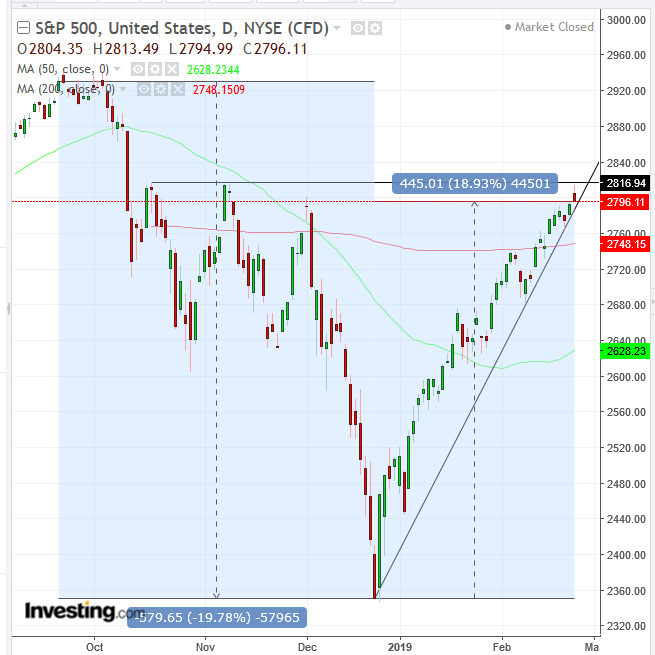
- S&P 500 nears 20% climb from Christmas, but technicals show weakness
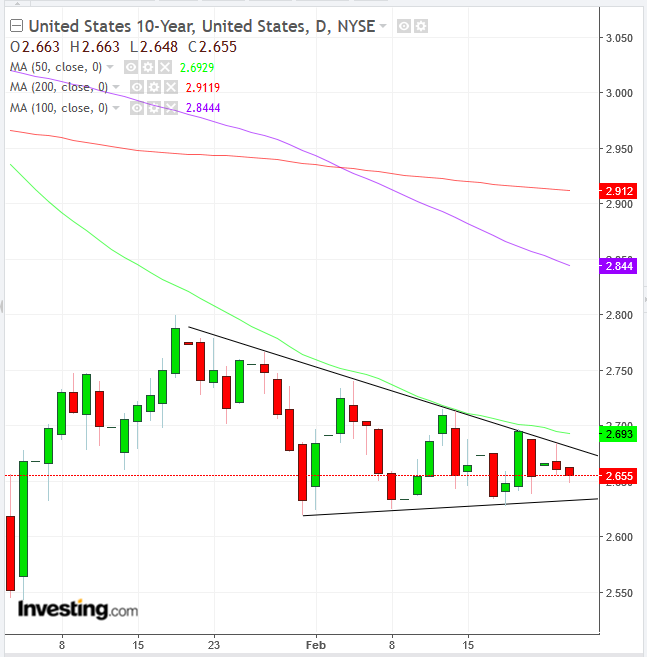
- 10-year yields continue bearish pattern
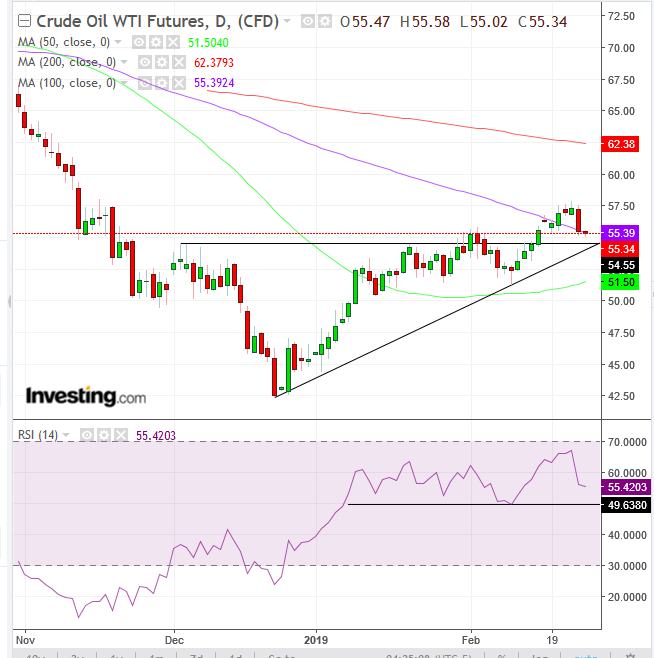
- WTI slips on Trump’s rhetoric
- Federal Reserve Chairman Jerome Powell delivers semiannual testimony on monetary policy and the state of the economy to House and Senate committees today and tomorrow.
- President Donald Trump and North Korea leader Kim Jong Un are expected to meet for a second summit beginning on Tuesday.
- Fourth quarter U.S. GDP data comes out on Thursday.
- The Stoxx Europe 600 slipped 0.4 percent, the largest decrease in more than two weeks.
- Futures on the S&P 500 fell 0.3 percent.
- The U.K.’s FTSE 100 dropped 0.9 percent to the lowest in more than two weeks on the largest decrease in almost three weeks.
- Germany’s DAX slid 0.5 percent, the first retreat in more than a week.
- The MSCI Emerging Market Index decreased 0.3 percent, the first retreat in more than a week.
- The MSCI Asia Pacific Index fell 0.4 percent, the first retreat in more than a week.
- The Dollar Index retreated less than 0.05 percent.
- The euro decreased 0.1 percent to $1.1348, the biggest dip in almost two weeks.
- The British pound gained 0.4 percent to $1.3146, the strongest in more than four weeks on the largest gain in a week.
- The Japanese yen climbed 0.2 percent to 110.83 per dollar, the biggest increase in more than a week.
- The yield on 10-year Treasurys declined one basis point to 2.65 percent.
- Germany’s 10-year yield fell one basis point to 0.10 percent, the lowest in more than two weeks.
- Britain’s 10-year yield advanced less than one basis point to 1.18 percent.
- Italy’s 10-year yield decreased one basis point to 2.764 percent, the lowest in more than three weeks.
- West Texas Intermediate crude slid 0.5 percent to $55.23 a barrel, the lowest in more than a week.
- Gold fell 0.2 percent to $1,325.45 an ounce.
Key Events
Global equities dropped and bonds rebounded this morning as exuberance over a delay in new U.S. trade tariffs waned. However, elsewhere, an unrelated delay had a more positive effect: the pound sterling leaped forward, hitting a 21-month high against the euro, after it was reported that British Prime Minister Theresa May was considering plans to rule out a no-deal Brexit—which in turn sparked speculation the March 29 deadline will be postponed. Meanwhile, an improved outlook on post-Brexit U.K. from Bank of England's Governor Mark Carney also lent cable a helping hand.
Futures on the S&P 500, Dow and NASDAQ 100 joined a global equity selloff and swung back to risk-off, while the STOXX Europe 600 slipped lower with most of its sectors.
The mood is likely to have turned sour after U.S. President Donald Trump said he might sign a deal with China, but, then again, it “might not happen at all”—thereby justifying our caution that markets probably priced in a resolution that may not happen as expected, especially with such a seemingly impulsive and outspoken U.S. president perpetuating uncertainty.
Earlier, in the Asian session, shares backtracked from yesterday’s rally, which had been prompted by Trump’s tweets announcing his intention to delay higher tariffs on Chinese exports to allow more time for a trade deal. China’s Shanghai Composite dropped 0.67%—though, after yesterday’s 5.6% surge, that should be considered as holding onto gains. Hong Kong’s Hang Seng slipped 0.65%, erasing yesterday’s gains. Japan’s Nikkei 225 dropped 0.37%, after brushing off a two-and-half month high. A weakening yen in the early global session probably offset deeper losses.
Global Financial Affairs
In yesterday’s U.S. session, stocks opened higher thanks to Trump's upbeat signals, shaking off the previous European decline and resuming an Asian rally. However, the main indices closed well off their highs, and small caps’ gains turned into losses before the day was out.

The S&P 500 eked out a 0.12% gain, led by a climb in Materials (+0.65%). Real Estate (-0.83%) prevented a more meaningful advance. Technically, the index needs to prove there is sufficient demand to overcome the 2,800 levels, where supply pushed prices back down in October, November and December. Interestingly, that would also mark the 20-percent level from the pre-Christmas bottom. As of yesterday’s close, prices have gained 18.93% since the Christmas-Eve trough.
Despite the fact that, strictly speaking, the market has always remained in bull market territory, the 19.78% fall from Sept. 21 2,929.67 peak till the 2,351.10 bottom posted on Dec. 24—and therefore the minimal distance from an official bear market—has had an impact on sentiment. Therefore, a 20% climb from the pre-Christmas bottom—the accepted gauge for a bull market—may yield a positive psychological effect on investors.
If in fact prices close above the October highs, we would reconsider our bearish position, while a fresh peak would force us to recalibrate with the market’s changing sentiment, despite our views on headwinds such as the Fed's tightening path, the lingering U.S.-China trade war, Brexit and U.S. politics.
The Dow Jones Industrial Average closed 0.23% higher, after going through the same pattern as the S&P 500 of closing well above highs.
The NASDAQ Composite sealed a 0.36% advance, outperforming its peers. It too went through the motions of an opening rising gap, extending the rally, to finally close well above its highs, just one day after closing above the 200 DMA. The tech-heavy gauge is 22.04 percent from its pre-Christmas bottom.
The Russell 2000 slipped into the red, closing 0.08% lower. Technically, it formed a shooting star, but since it closed the gap, there is no potential for an Evening Star/Island Reversal. The price closed right on the 200 DMA, demonstrating how the index is on the edge of a knife. Also, the RSI, at 75, is the most overbought since August, which preceded the drop since its record peak.
Meanwhile, traders are focused on the semiannual testimony delivered by Federal Chair Jerome Powell on the state of the U.S. economy. This event, taking place today and tomorrow, could potentially be a market-mover, as Powell will have the chance to clarify whether markets have been interpreting his January address correctly.

The yield on 10-year Treasurys was seen losing ground for a second day, after touching the top of a bearish pattern, as we predicted.

WTI also extended losses this morning after tumbling the most in four weeks on criticism from Trump, directed at OPEC, that oil prices are too high. Technically, the price is falling toward its uptrend line since December 24, its $55 support since December 4 and the 100 DMA. The RSI is falling toward its support since January.

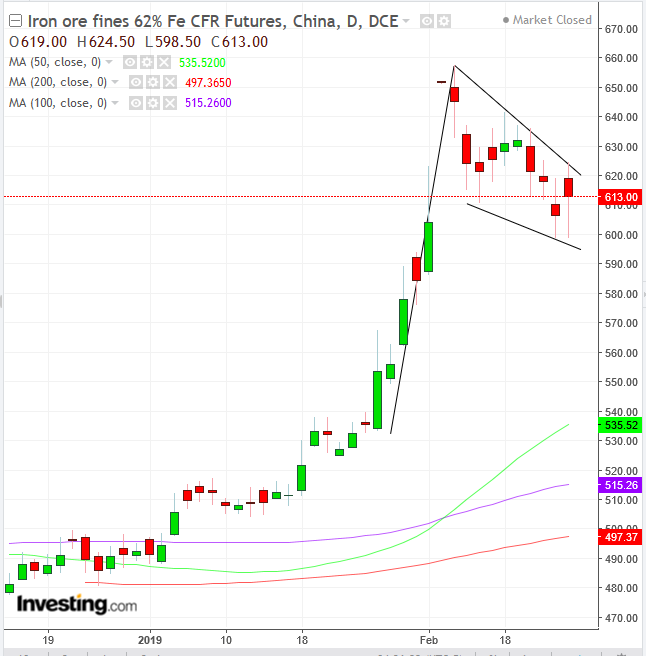
Iron ore retreated after Barclays warned the metal may erase all its dam-disaster-led gains this year. Technically, however, the commodity is forming a falling flag, bullish in an uptrend and predictable after the 22% jump in the six sessions Jan. 28-Feb. 11. The metal was climbing into positive territory by late European morning.
Up Ahead
Market Moves
Stocks
Currencies
Bonds
Commodities
