Fresh US-China trade salvos pressure European shares, US futures
- NASDAQ outperforms on Apple's earnings beat and hopes of easing trade war
Dollar ticks higher, weighs on EM currencies and commodities
- Oil slips on higher output expectations, stronger USD
Earnings season continues:
Tesla (NASDAQ:TSLA), due Wednesday, EPS $2.78 & revenue $4.03 forecast
Barclays (LON:BARC), due Thursday, EPS $0.28 & revenue $6.94B forecast
Berkshire Hathaway (NYSE:BRKa), due Friday, EPS 3,398.89 & revenue 61.64B forecast Toyota, due Friday, EPS $3.95 & revenue $65.15B forecast
The US Treasury is set to release its funding program for the next three months on Aug. 1.
Central banks in the US, UK, Brazil, and India are meeting over the week.
The US jobs report comes out on Friday and is predicted to show a healthy labor market, with 190,000 new jobs.
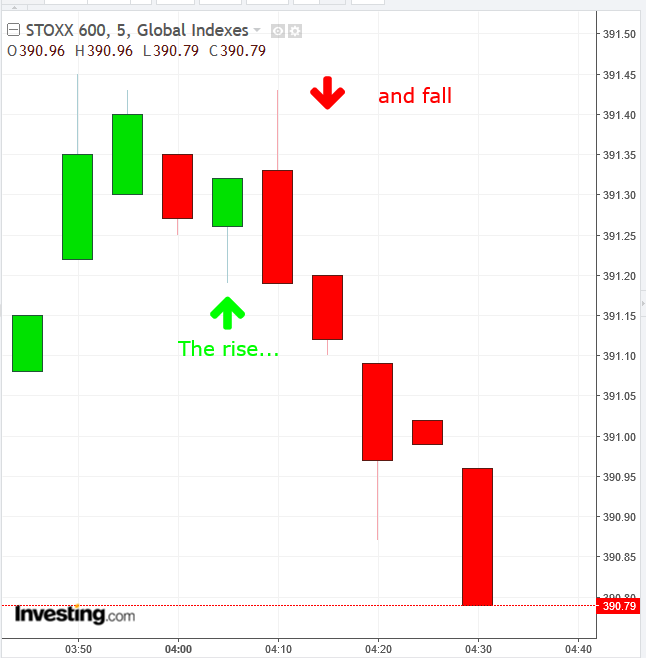
The STOXX Europe 600 dropped 0.1 percent.
Futures on the S&P 500 gained less than 0.05 percent.
The MSCI All-Country World Equity Index slid less than 0.05 percent.
The MSCI All-Country World Index lost 0.1 percent to the lowest level in more than a week.
The Dollar Index climbed 0.07 percent, giving up a 0.15 percent advance, forming a shooting star.
The euro fell less than 0.05 percent to $1.1689.
The British pound slipped less than 0.05 percent to $1.3123.
The Japanese yen slid 0.2 percent to 112.10 per dollar, the weakest level in almost two weeks.
The yield on 10-year Treasuries gained two basis points to 2.98 percent, the highest level in almost ten weeks.
Germany’s 10-year yield rose two basis points to 0.46 percent, the highest level in seven weeks.
Britain’s 10-year yield climbed three basis points to 1.33 percent, the highest level in seven weeks.
The Bloomberg Commodity Index slipped 0.7 percent to the lowest level in more than a week on the most significant fall in more than two weeks.
West Texas Intermediate crude fell 0.8 percent to $68.19 a barrel, the lowest level in more than a week.
LME copper declined 1.5 percent to $6,204.00 per metric ton, the lowest level in more than a week on the biggest drop in three weeks.
Gold lost 0.2 percent to $1,221.18 an ounce, the weakest level in almost 13 months.
Key Events
A fresh round of trade headwinds hit equity markets on Wednesday, sending European shares and futures on the S&P 500 and Dow Jones lower, while contracts for the NASDAQ 100 managed to edge higher on Apple (NASDAQ:AAPL)’s earnings beat.
The pan-European STOXX 600 opened higher but then started sliding lower erasing most of yesterday's gains.

The Trump administration is said to be considering hiking its levies on $200 billion worth of Chinese goods from 10 to 25 percent, which in turn sparked accusations, by Chinese officials, that the US is "blackmailing and pressuring" the country to change its trade stance. Worries that US President Donald Trump's latest threats will translate into action dragged miners stocks on the European benchmark lower, despite Rio Tinto (LON:RIO) posting upbeat earnings, in line with expectations.
Carmakers, another sector that is sensitive to exports jitters, managed to eke out a gain after Volkswagen (DE:VOWG_p) reported solid results for the second quarter, although it warned that trade tensions posed great challenges in the months ahead.
A few reasons may have prompted Trump to raise the stakes on trade.
First, economic figures are showing a diverging impact of trade tensions on Chinese and US growth. China's non-manufacturing purchasing managers index dropped to 54.0 in July from 55.0 in June, hitting an 11-month low. Moreover, Chinese assets including the yuan, equities and 10-year yields are at or near year lows.

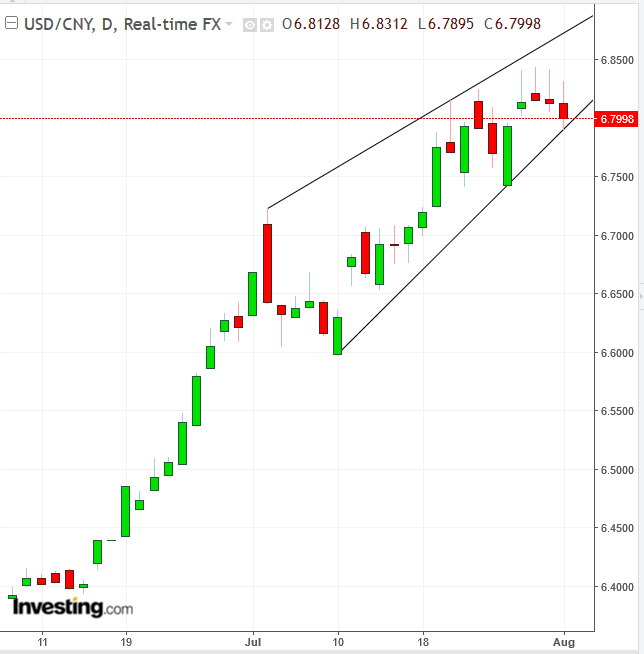
Adding to that, Chinese policymakers weakened the fixing for the yuan to the lowest level since May 2017. Interesting, despite the weaker fixings, the dollar is falling a third straight day versus the yuan, confirming the three preceding shooting stars. So far, it finds support by the uptrend line since July 10, but a downside breakout would complete a bearish, rising wedge. This pattern demonstrates that over-eager demand has run out of steam.
On the opposite side of the spectrum, US GDP hit an annual 4.1 percent growth in the second quarter, the fastest pace in four years. The S&P 500 is up 5.34 percent year to date and stands 2 percent away from its record high; the yield on 10-year bonds is 5 percent away from a 7-year high, and the dollar is 10 percent below a 6-year high.
Global Financial Affairs
Trump's fresh threats quickly overtook earlier reports that talks between Washington and Beijing were set to resume, clouding investor outlook and weighing on Asian equity markets, which closed mixed.
Earlier, in the US session, those same reports boosted trading, allowing investors to rotate into larger cap stocks: the NASDAQ Composite outperformed (+0.55 percent) smaller-cap, domestic shares on the Russell 2000 (+ 0.22 percent).
The SPX climbed 0.49 percent, led by two growth sectors, Consumer Discretionary and Technology. Materials was one of the only two sectors in red, dragged lower by lingering trade worries.
The Dow Jones Industrial Average gained 0.43 percent.
Investor focus will now shift to central bank policy, after the BOJ slightly stepped up its threshold for yields to 0.2 percent from 0.1 percent Tuesday. The Federal Reserve is expected to hold rates at 2.00 percent today and the Bank of England to increase rates to 0.75 percent from 0.50 percent tomorrow.
In other news, the greenback ticked higher against most of its major peers for a second day, weighing on emerging market currencies. Commodities dropped as crude slipped on expectations of an increase in production, as well as on the stronger USD.

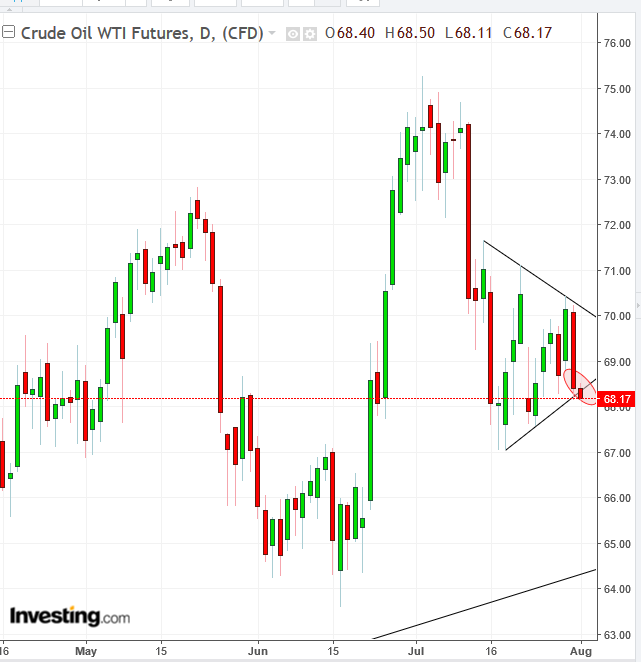
Oil is penetrating the bottom of a pennant. Should it close with a downside breakout, it would suggest that prices will continue to fall, toward the uptrend line since mid-November 2017, as sellers lower their asking prices to find willing buyers.
Up Ahead
Market Moves
Stocks
Currencies
Bonds
Commodities
