Key Events
US earnings season is being ushered in by fresh stock market records. Indeed, the only major US index which failed to post a new high yesterday was the usual suspect, the Russell 2000. Moreover, while each of the remaining three major US indices gained, the Russell 2000 retreated. It was down 0.13 percent.
The Dow Jones Industrial Average hit its fourth record within six trading days, while both the S&P 500 and NASDAQ Composite were 6 for 6—a perfect score: six records over six consecutive trading days.
Treasuries, on the other hand, sold off.
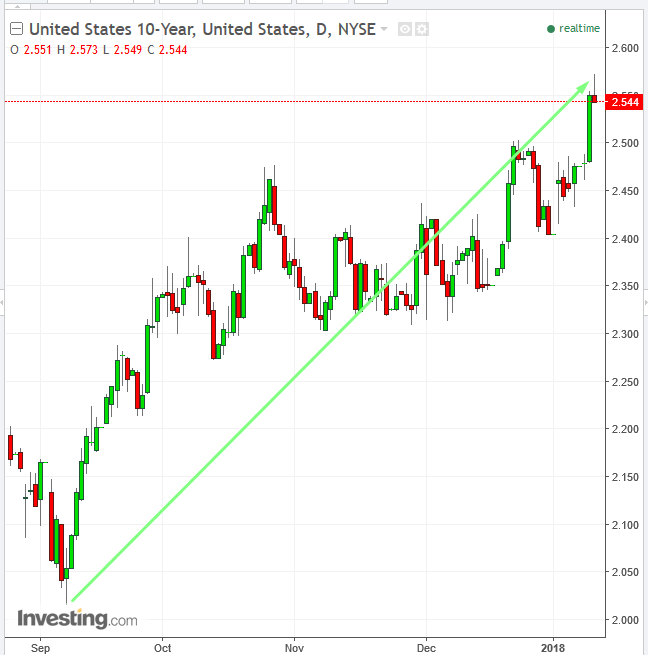
The 10-year yield rose, crossing 2.55 percent, a nine-month high. While record setting equity rallies correlated to falling Treasuries portray investors as wholly bullish, a deeper take could provide a more complex picture.
On the surface, it would be expected that some investors might rotate funds out of Treasuries into outperforming stocks. Nevertheless, there are probably two more relevant reasons this is happening now:
1. The BoJ unexpectedly stopped buying long-dated bonds—something we discussed in detail here—exacerbating a pre-existing supply glut, as central banks shrink balance sheets, prompting investors to sell off.
This led to:
2. Janus Henderson Group’s bond portfolio manager and billionaire Bill Gross kicking Treasuries when they’re down, announcing yesterday that bonds had entered a bear market, in which the presumed momentum is down while rallies are considered nothing more than corrections, even a shorting opportunity.
Global Financial Affairs
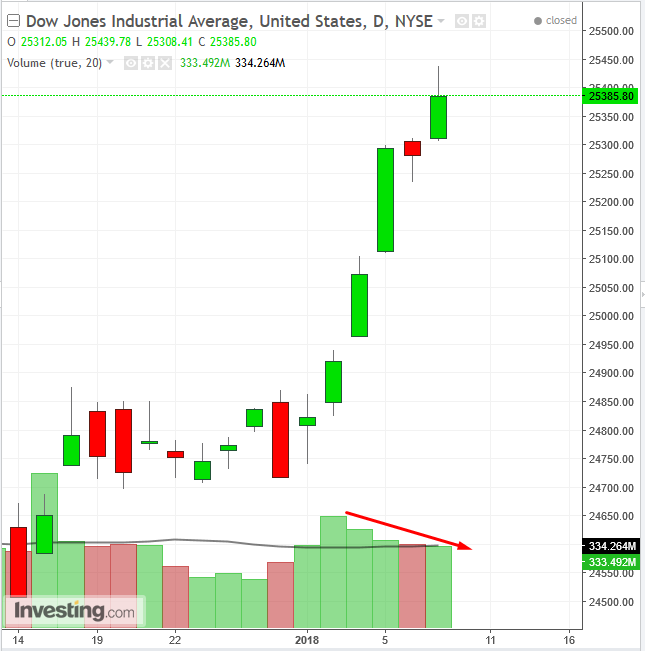
While the Dow set its fourth record yesterday, each new high has been supported by ever diminishing volume, as demand dries out. Of equal interest, even as the S&P set its perfect sixth record yesterday, on broader market participation (in which the shares of a growing number of companies keep rising, indicating it's an all-encompassing rally) yesterday’s trade failed to hold on to early gains, except for the opening gap. By the close gains were pared back from 2,759.14 to 2,751.29, only 0.14 points above the opening price.
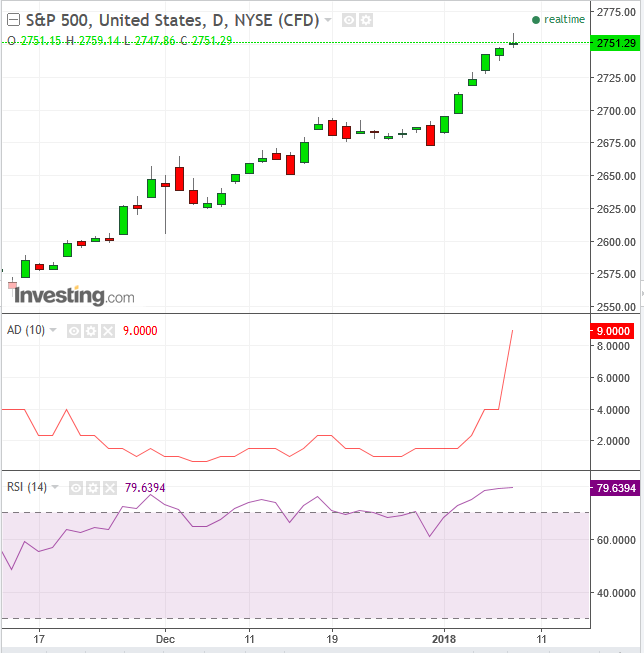
The Japanese say that a doji forming in an overbought condition signals that the market is tired. It certainly doesn’t mean an immediate reversal. Rather, it's a sign that the price is vulnerable to bearish attacks.
It’s natural then to acknowledge that this market is overbought: the Dow Jones posted 70 records in 2017, the highest number of record closes for a year ever for the index, surpassing the previous record of 69, made in 1995; the S&P and NASDAQ Composite have each had a perfect 6 record run over the past 6 trading days, including 5 rising gaps; the S&P 500’s momentum RSI has reached 79.63, the most overbought condition since October 20.
Internally, the S&P 500's defensive Health Care sector led the advance, gaining 1.18 percent, while Real Esate, a growth sector, led the decline, losing 1.14 percent.
Overall, the bulls remain in control of the US stock market, but bears are actively trying to claw back control.
Most Asian markets headed lower this morning. Japan’s TOPIX retreated 0.15 percent, while the Nikkei 225 slid 0.25 percent: South Korea’s KOSPI dropped 0.4 percent, but mainland China’s Shanghai Composite advanced 0.25 percent and Hong Kong’s Hang Seng rose 0.2 percent.
The Stoxx Europe 600 Index followed suit, ending its 5-day rally which had included rising gaps that registered a fresh peak after scaling above the November 1, 398.05 high.
While conventional market structure suggests an inverse relationship between stocks and bonds, as investors choose between growth and safety, they are also trying to figure out whether the current bond selloff is an early warning regarding the end of global growth and the rising inflation that would occur. Yesterday, the argument of bond investors scored a point over equity investors.
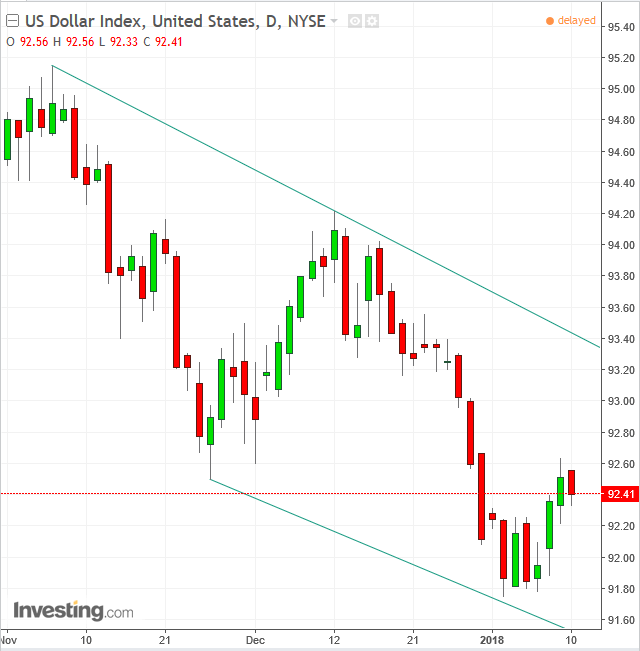
The dollar index wiped out almost all of yesterday’s gains this morning, possibly on the Treasury selloff by international investors. As well, the yen climbed for a second day as traders unwound short positions in the wake of the Bank of Japan tapering ultra-long dated bond purchases.
China’s central bank weakened its daily yuan fix by the most since September, one day after a report showed it has adjusted its currency-fixing mechanism, a move interpreted as an embrace of greater fluctuation in the exchange rate.
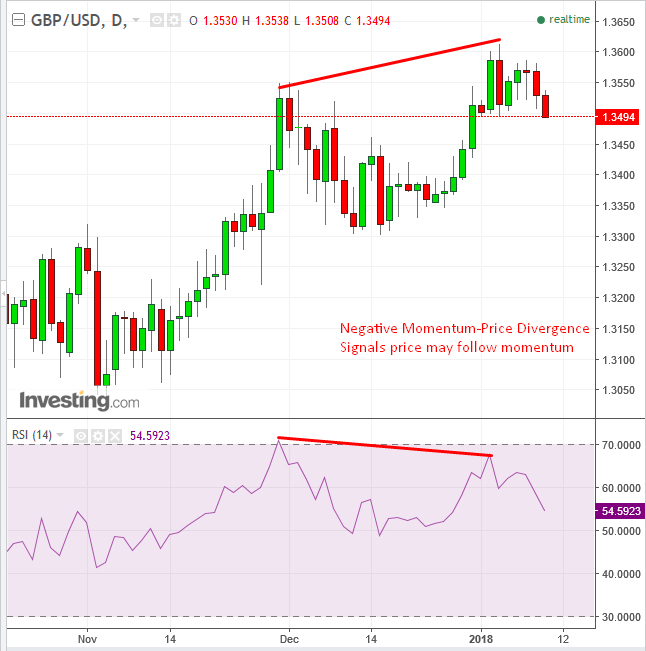
The pound extended its decline for a third day after Monday’s HPI release in which the MoM metric fell to a negative 0.6 percent from +0.3 percent previously, much lower than the 0.2 percent growth expected. In addition, last Thursday’s consumer credit release showing 1.400B fell short of the 1.500B forecast, suggesting the UK’s economy is contracting. As well, reports that UK PM Theresa May might create a position for a minister for a contingency plan should a failure to reach a Brexit deal occur undermined sentiment; and last but not least, May’s attempt to pick up the pieces after a Trump-style cabinet reshuffle, caused uncertainty to spike.
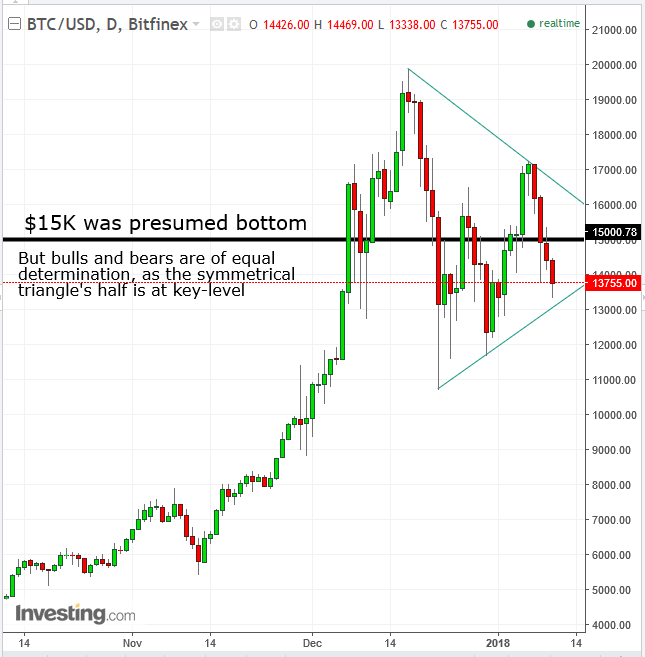
Bitcoin fell through the $15,000 glass floor investors thought was made of stronger stuff, sinking for a fourth day. It was the cryptocurrency's longest losing streak since the December selloff, undoubtedly playing on trader fears of a repeat move.
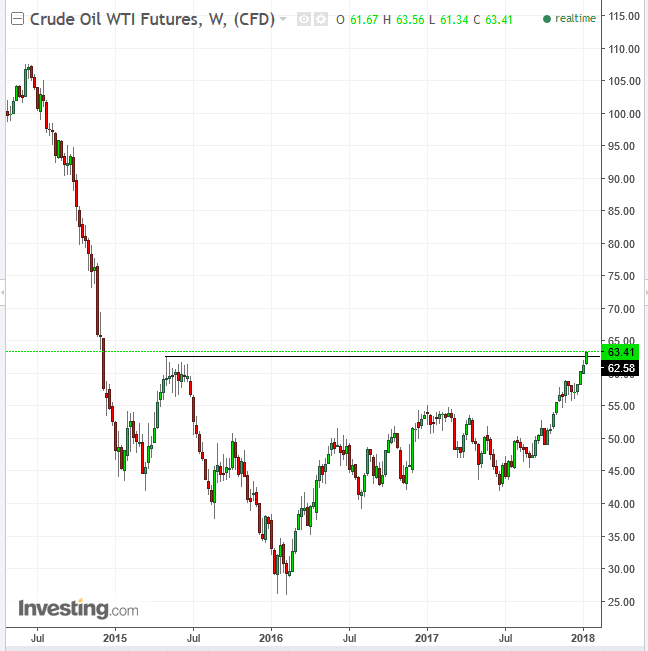
Crude eased after breaking the $63 level. Its gains were driven by yesterday's API weekly stockpiles report which showed inventories dropped by a much-greater-than-expected 11.2 million, an eight week fall. The commodity's price reached its highest level since 2014, but analysts warn of an overheating market. Technically, the price posted a fresh peak, above the May 5, 2015 high of $61.01, completing a formal bottom of the 2014 crash.
Up Ahead
- U.S. inflation data, released Friday, is forecast to show price pressures remain muted for now, giving hawks little reason to argue for faster tightening.
- St. Louis Fed President James Bullard and head of the New York Fed Bill Dudley are among central bankers scheduled to speak this week.
- Delta Airlines (NYSE:DAL) reports earnings tomorrow before the open.
Market Moves
Stocks
- The Stoxx Europe 600 Index sank 0.3 percent, the first retreat in more than a week and the largest decrease in three weeks.
- The MSCI All-Country World Equity Index dipped less than 0.05 percent, the first retreat in more than a week.
- The MSCI Emerging Markets Index sank 0.4 percent, the largest decrease in more than four weeks.
- The MSCI Asia Pacific Index declined less than 0.05 percent, the first retreat in more than a week.
- S&P 500 Futures fell 0.2 percent, the first retreat in more than a week.
Currencies
- The Dollar Index declined 0.13 percent.
- The euro increased 0.1 percent to $1.1951.
- The British pound fell 0.2 percent to $1.3515, the weakest in more than a week.
- The Japanese yen jumped 0.6 percent to 111.93 per dollar, the strongest in six weeks on the largest climb in four weeks.
Bonds
- The yield on 10-year Treasuries increased less than one basis point to 2.56 percent, reaching the highest point in 10 months on its fifth straight advance.
- Germany’s 10-year yield climbed eight basis points to 0.55 percent, the highest in more than five months on the largest surge in about six months.
- Britain’s 10-year yield gained one basis point to 1.288 percent, the highest in almost six weeks.
Commodities
- Gold increased 0.1 percent to $1,314.38 an ounce.
- West Texas Intermediate crude gained 0.8 percent to $63.48 a barrel, the highest in more than two years.
