Key Events
Late yesterday, just four days shy of the two month anniversary of the German general election, Chancellor Angela Merkel—who had already lost 20% of the votes she'd garnered during the previous, 2013 election—saw her attempt to cobble together a coalition government collapse. This, after a month of exploratory coalition talks between Merkel's Christian Democratic Party, the Green Party and the smaller, though in this case lynchpin, Free Democratic Party. Negotiations reached an impasse before midnight Sunday on a dispute over migration policy and the FDP broke off talks.
On September 25, the day after the election we noted:
The electoral results in Germany may mean that Merkel will be unable to form a viable coalition for months, introducing considerable uncertainty for the single currency.
Sure enough, there is already talk of a possible new election. However, according to the Wall Street Journal, "analysts said none of Germany's parties had an obvious contender to assume her mantel."
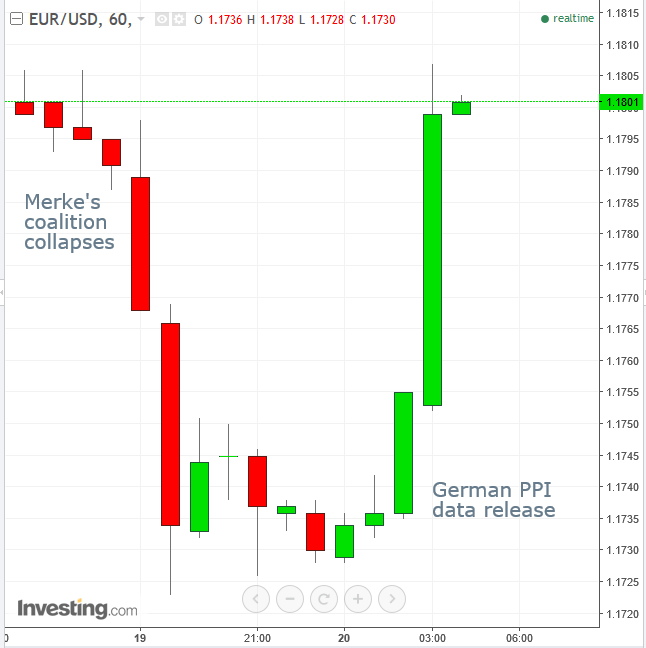
The euro dropped as much as 0.64 percent during the early Asian session, but between 2 and 4 AM EDT it rebounded on positive economic news when German PPI MoM and YoY met expectations, rising 0.3 percent and 2.7 percent respectively. After the release, previous losses were wiped out and the single currency actually climbed 0.8 percent, higher than it had been when trading started.There's nothing like cold hard economic data with which to erase any whiff of instability generated by political pundits.
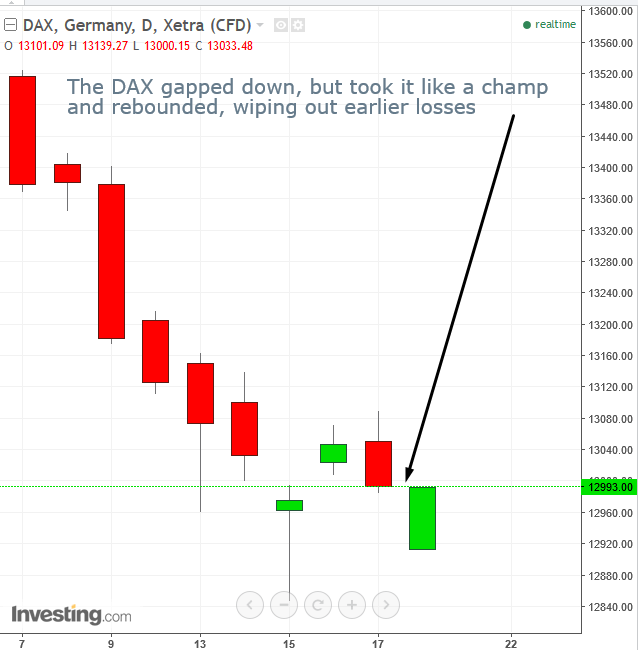
Also this morning, Germany’s DAX fell to a seven-week low to start the trading week, leading major European benchmarks lower. However, after gapping down 0.61 percent, the DAX pared losses to just 0.16 percent, as of 4:07 EDT. As with the euro, it demonstrates that investors think less of politics and more about economics. The continued, sustainable economic growth in Germany and the eurozone is providing all the certainty investors require, in lieu of political stability.
Global Economic Affairs
After China’s ongoing regulatory crackdown on risky, highly leveraged trades seemed to enter yet another phase late Friday, Chinese equities, including the Shanghai Composite, were hit this morning.
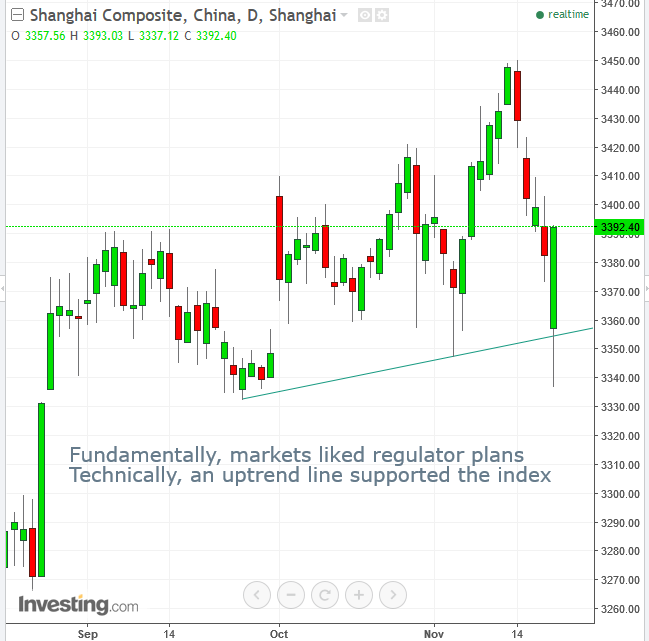
However, as investors had an opportunity to take a closer look at the details of the newly drafted rules, including the prohibition of implicit guarantees regarding returns, markets rebounded.
With the exception of China, equities in other parts of Asia extended losses. The MSCI Asia Pacific Index slipped half of one-percent last week, ending a rally that moved the index 6 percent higher. The rally halted at the pre-2008 crash high, spurring many technical analysts, including Bloomberg, to forecast "a massive double top, as equities in Asia show fatigue." In other words, investors may be too scared to keep supporting additional rallies.
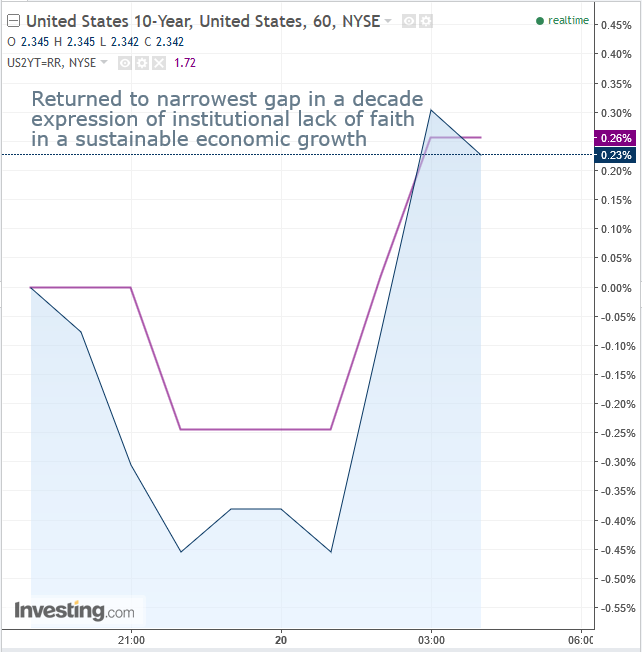
The spread between 2-year and 10-year Treasury yields is the stuff that gives institutional investors heartburn. It's returned to its narrowest level in a decade, a clear indication of a lack of faith in sustainable US economic growth, now being expressed—via the spread—by the smart money.
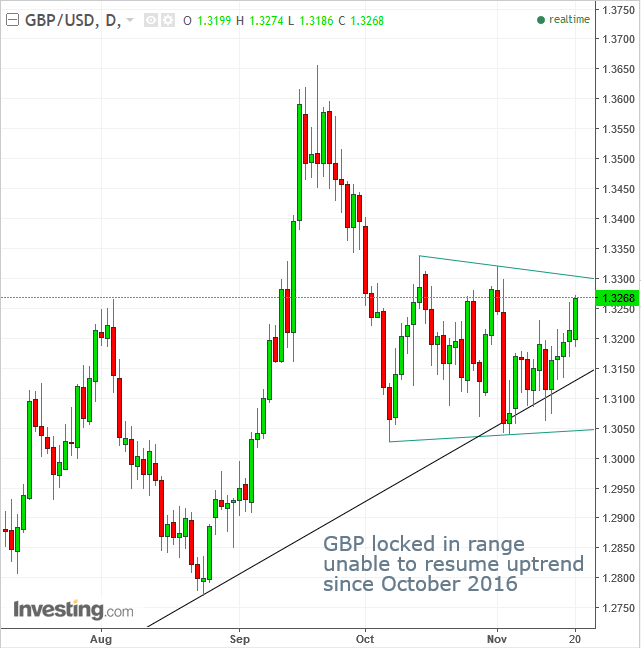
The battered British pound, which has been locked in a range since October 13, received a boost from reports the UK may increase their 'divorce fee' offer to the EU ahead of the critical meeting with EU leaders in December.
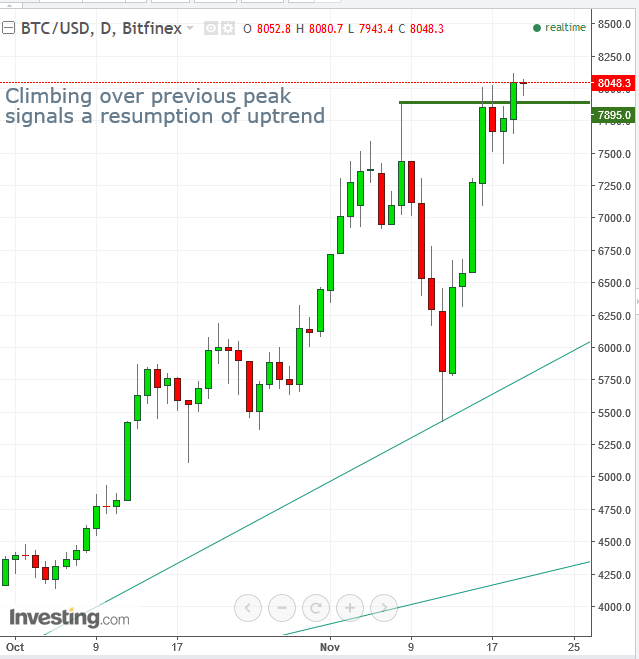
Bitcoin climbed past $8,000 for the first time on Sunday, after traders were able to set aside technology concerns that had led the most popular cryptocurrency into a 29 percent crash. Speculation that a SegWit2x hard fork might still be a possibility may have also driven the digital currency's price higher.
Bitcoin has had a remarkable year so far. The opening price at the beginning of 2017 was $966.60. On January 30, it broke the $1,000 level and reached $1,241.30 on March 2, besting the price of gold for the first time, which was then trading at $1,1.25.
On May 15, Bitcoin broke above $2,000 and less than a month later, on June 12, it hit an intra-day high of $3,000. As June closed, the cryptocurrency moved past the $3,000 mark, settling at $3,265.40. By August 8, it had closed above $3,500, nearly triple the price of gold at the time, which was then trading at $1,262.60.
That said, the gold market is worth trillions while Bitcoin’s market cap was only about $57 billion at the time. However, by August 13 the cryptocurrency had climbed above $4,000 and rapidly moved toward the $5,000 level which it reached on September 2. On October 20, it passed through the $6,000 mark and on November 2, it broke the $7,000 barrier; barely two weeks later it's topped $8,000. And there's still more than a month to go before the close of 2017.
While, this may sound like a fairy tale—and it surely must be for early Bitcoin investors—one should always keep in mind the oft-repeated disclaimer popular in financial literature: past performance is not indicative of future results. Since this is largely a sentiment-driven market, it's highly unpredictable. Like Facebook (NASDAQ:FB) and eBay (NASDAQ:EBAY) previously, which didn’t start as businesses, by happy accident they all turned into some of the most successful ventures in history. That's a lot riding on happy accident.
We've tried to use the principles of technical analysis to forecast future BTC moves, but didn't succeed. Still, based on studying the digital currency's balance of supply and demand, posting a price higher than a previous peak signals a resumption of an uptrend, whereupon a long trade may be entered.
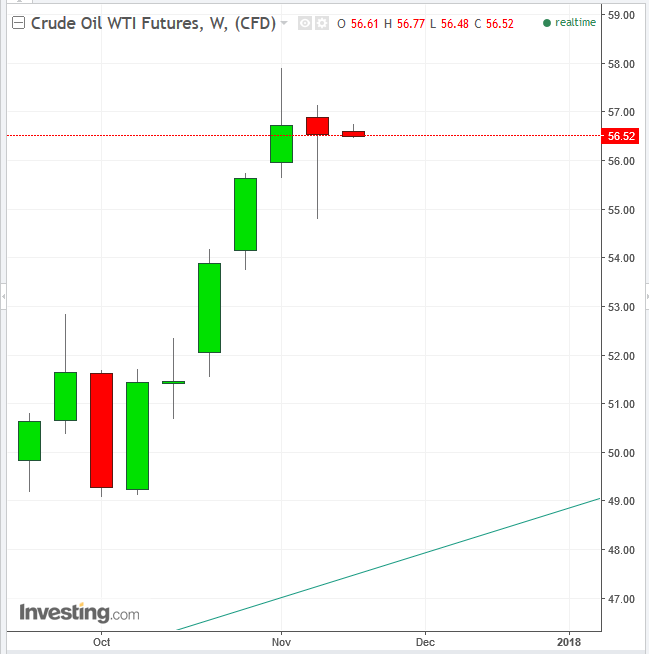
WTI crude held on to gains above $56 after Friday’s surge, which was spurred by Saudi Arabia’s supply cut extension plans. In yesterday’s Week Ahead post, we indicated that WTI’s price had formed a weekly hanging man. When it's confirmed with a following closing price beneath the hanging man’s real body, it suggests a decline will ensue. Thus far, the price is 3 cents below, as of 4:53 AM.
Up Ahead
- Federal Reserve Chair Janet Yellen gives a talk at New York University on Tuesday.
- Reports on sales of previously owned homes and durable goods orders for October are due in the U.S on Tuesday and Wednesday respectively.
- The minutes from the Fed’s latest policy meeting are out on Wednesday. Market participants will get a fresh read on Fed officials’ eagerness to boost the benchmark interest rate in December, something widely expected by markets.
- On Tuesday US but early Wednesday Asia, Taiwan updates on October unemployment and Hong Kong’s October CPI is out. Singapore's 3Q GDP is due on Thursday. New Zealand's October Trade and South Korea's November Consumer Confidence figures are also due out later in the week.
- The U.K. releases its budget Wednesday. Great Britain could see a significant economic downgrade amid a continued impasse in its negotiations with the EU on Brexit.
Market Moves
Stocks
- The Stoxx Europe 600 Index dipped less than 0.05 percent as of 8:45 a.m. London time.
- The U.K.’s FTSE 100 fell 0.4 percent, to its lowest in more than seven weeks.
- Germany’s DAX sank 0.2 percent to the lowest in almost four weeks.
- Japan’s Nikkei 225 decreased by 0.6 percent.
- The MSCI Asia Pacific Index declined 0.1 percent.
- The MSCI Emerging Markets rose 0.1 percent to the highest in more than six years.
- S&P 500 Futures decreased 0.2 percent to 2,572.00.
Currencies
- The Dollar Index dipped 0.02 percent, paring a 39 percent gain.
- The euro rose 0.1 percent to $1.1798, the strongest in almost four weeks.
- The British pound climbed 0.4 percent to $1.3264, the strongest in almost three weeks.
- The Japanese yen declined less than 0.05 percent to 112.13 per dollar.
Bonds
- The yield on 10-year Treasuries fell one basis point to 2.34 percent.
- Germany’s 10-year yield increased less than one basis point to 0.36 percent.
- Britain’s 10-year yield climbed one basis point to 1.309 percent.
- Japan’s 10-year yield increased less than one basis point to 0.038 percent.
Commodities
- West Texas Intermediate crude gained 0.1 percent to $56.62 a barrel, the highest in a week.
- Gold dipped less than 0.05 percent to $1,291.81 an ounce.
- Copper fell 0.3 percent to $3.08 a pound.
