The breakthrough in relations between Russia and Saudi Arabia removes some of the downside risk to oil prices and could lead to continued strength as the global economy recovers later this year.
After failing to reach a deal on Monday, oil producing countries led by Saudi Arabia and Russia reached an agreement yesterday to cut production until at least March, sending West Texas Instruments crude prices soaring in midday US trade.
In terms of details, Russia and Kazakhstan will increase production by a total of 75K barrels per day, but Saudi Arabia is voluntarily cutting its production by a full 1M bpd through February and March, leading to a net production cut of over 900k bpd. The so-called “OPEC+” group reached the decision amidst the slow rollout of the COVID-19 vaccine globally and the potential for additional short-term lockdowns as a more virulent strain of the virus proliferates. In the words of Saudi energy minister Prince Abdulaziz bin Salman:
“As we see light at the end of the tunnel, we must—at all costs—avoid the temptation to slacken off our resolve. Do not put at risk all that we have achieved for the sake of an instant but illusory benefit.”
While the decision to delay planned output increases is bullish for oil prices on its own, the fact that the diverse group of oil-producing countries were able to work through previously-strained relations to coordinate production is perhaps the bigger takeaway; many traders will recall that just last year, a standoff between Russia and Saudi Arabia over production contributed to oil prices briefly crashing into negative territory.
The breakthrough in relations between Russia and Saudi Arabia removes some of the downside risk to oil prices and could lead to continued strength as the global economy recovers later this year. It’s worth noting that the group is still producing over 7M bpd less than it was before the start of the pandemic, so we remain far from a “return to normal” in terms of global oil consumption.
Technical outlook
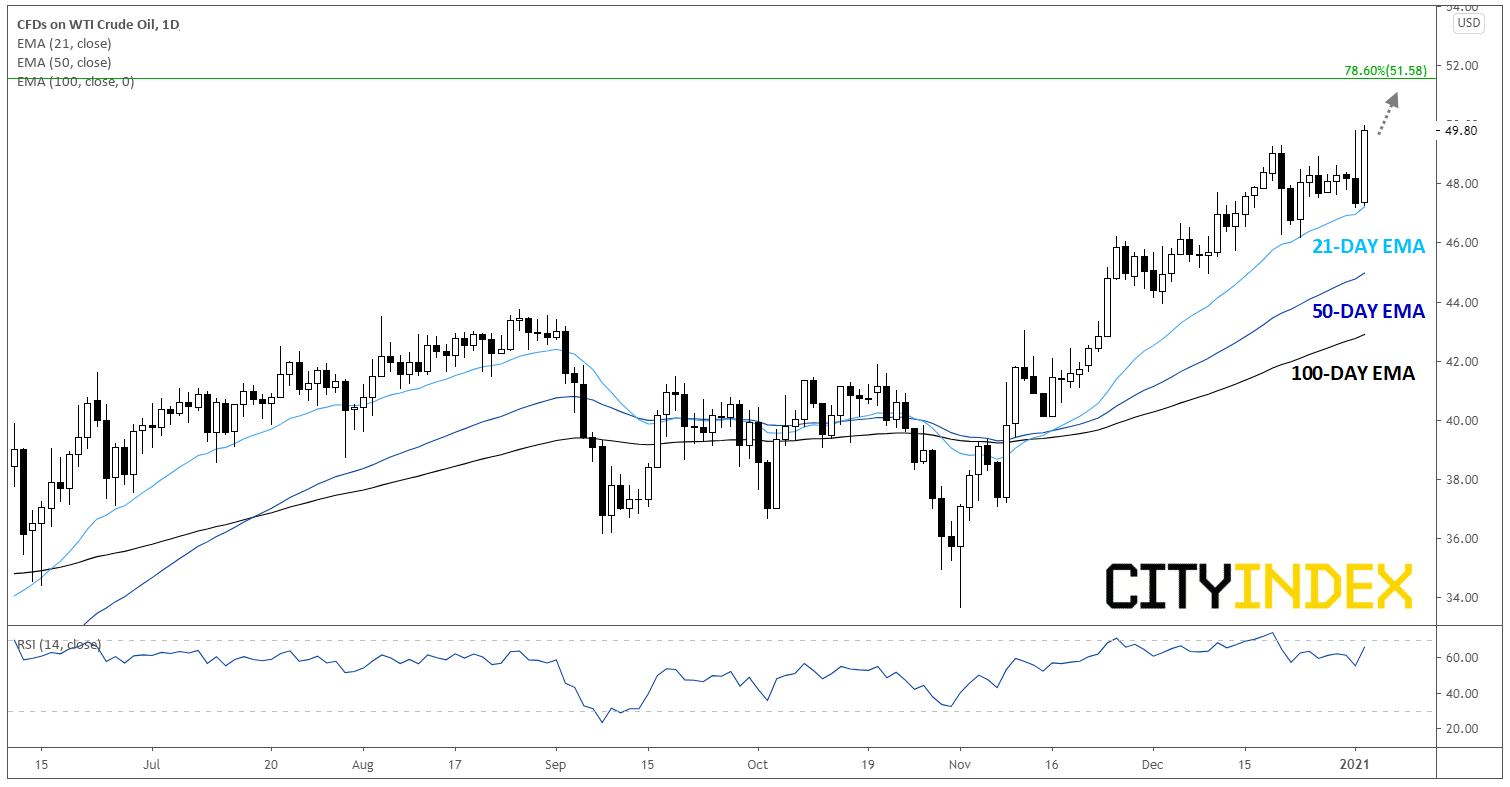
For the first time since February, WTI crude oil touched $50.00/barrel. Turning our attention to the chart, WTI is trading solidly above its 21-, 50-, and 100-day EMAs, signaling an established bullish trend. Meanwhile, the price consolidation around $48.00 at the end of last year has alleviated the overbought condition in the RSI indicator, potentially paving the way for additional gains in the future:

To the topside, bulls will look to the 78.6% Fibonacci retracement of the pandemic swoon in the mid-51.00s as a logical target area. On the other hand, a break below the 21-day EMA at 47.20 could open the door for a deeper retracement, but buyers may nonetheless step in around the 50-day EMA near $45.00 given the bullish fundamental and technical backdrop.
