Economic data on Friday was mixed but the U.S. dollar was seen giving up some of the gains made from earlier in the week. Japan's national core CPI data showed a 0.7% increase on the year, unchanged from the month before.
In the Eurozone, the preliminary manufacturing and services PMI data showed a somewhat mixed picture. While the manufacturing PMI for the Eurozone eased to 55.0, services sector surged ahead with the index rising to 55.0 up from 53.8 in the previous month.
OPEC leaders were seen reaching an agreement to raise production by an additional one million barrels per day. Crude oil prices surged on the news.
In the U.S. trading session, data from Canada dominated the headlines. Canada's inflation increased just 0.1% on the month putting the annual inflation rate to 2.2%, which was unchanged from the month before. Retail sales however disappoint,compared to the previous month, raising doubts on whether the BoC could hike rates in July.
Looking ahead, the economic calendar for the day is quiet. The German Ifo business climate data is expected to be released. Forecasts show that business expectations might have eased to 101.9. In the U.S. trading session, new home sales data is expected to show a modest increase to 665k on the month, up from 662k registered the month before.
EUR/USD intra-day analysis

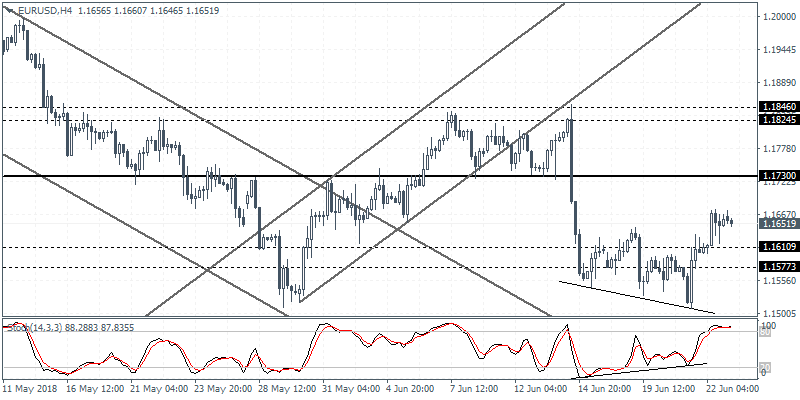
EUR/USD (1.1651):The EUR/USD currency pair managed to turn bullish on Friday following through from Thursday's gains. Price action posted a rebound off the support level near 1.1539 level with the bullish divergence being validated on the 4-hour chart. To the upside, we now expect the currency pair to test the resistance level at 1.1730 and the EUR/USD could potentially turn into a sideways range within these levels. A breakout above 1.1730 could trigger further gains toward the 1.1824 - 1.1846 level of resistance. To the downside, the declines are limited as long as the support at 1.1610 is not breached.
USD/JPY intra-day analysis

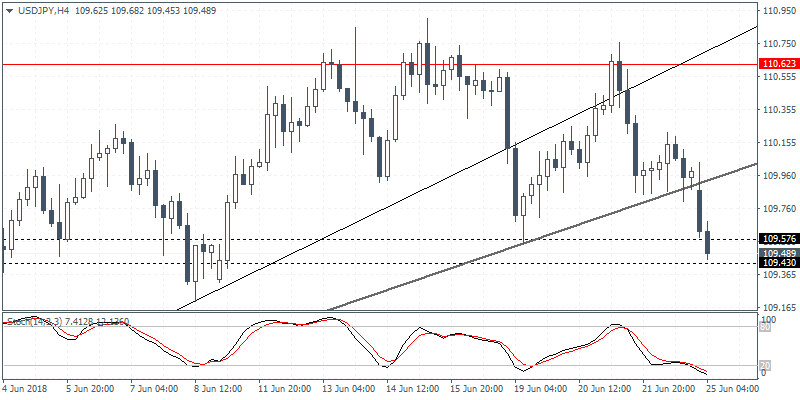
USD/JPY (109.48):The USD/JPY currency pair was seen testing the dynamic support of the major rising trend line. While this could offer some upside support in the near term, we expect that the momentum has eased a bit. The USD/JPY could potentially turn higher but form a lower high. To the downside, a breakout from the rising trend line could trigger a decline to the support level at 109.57 - 109.43 region. Establishing support at this level could keep the currency pair supported in the near term.
XAU/USD intra-day analysis

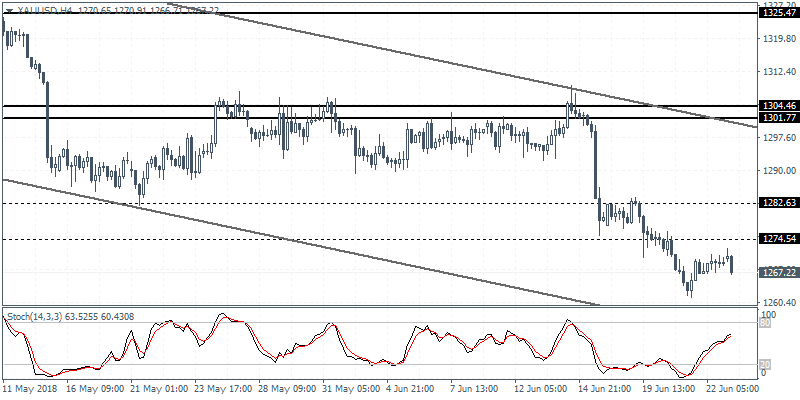
XAU/USD (1267.22):Gold prices are seen easing their declines with price action on the daily chart closing with a doji pattern on Thursday and a follow through with some bullish gains on Friday. This pattern potentially indicates some upside momentum in price action. Gold prices will now have to test the resistance level at 1274 region in order to post any further gains. The downside is likely to be limited for the moment. A breakout from 1274 could keep price action under pressure within the 1282 and 1274 price levels.
