Most science and technology funds are passively-managed and capitalization-weighted. Not this one! It might well be a valuable adjunct to such homogeneity...
We used to think of tech stocks as those engaged in science and technology that would likely change the way we live, defend our nation, build things, transport ourselves, secure resources, and so on. Somewhere along the way the “science” part got moved into the sectors with which they deal – aerospace firms into the Industrials sector, those pursuing interesting avenues in alternative energy into the Energy Sector, new hardware for medical diagnostics into the Health Sector, etc.
What Big Tech is now is mostly productivity and entertainment companies. Just take a look at the heat map of the S&P 500 below:
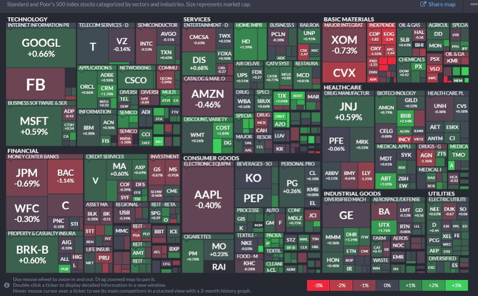
If you aren’t familiar with heat maps, they provide a visual overview of their subject, in this case the stocks of the S&P 500. This one is courtesy of www.finviz.com. If you visit their site you will find it to be interactive – you can zoom in to see each component by name within finviz’s sector choices. (finviz uses 8 sectors, the Sector SPDR ETFs – http://www.sectorspdr.com/sectorspdr/sectors uses 10, another source may use another number.)
While most sources show Amazon (NASDAQ:AMZN) (correctly) as catalog and mail order in the Services Sector, let’s face it – everyone thinks of it as a tech stock (and it is earning more money these days from providing data services and, who knows, maybe soon from organic kale and tofu as well.)
While most sources show Apple (NASDAQ:AAPL) (again, correctly) as electronic equipment in the Consumer Goods Sector, there can be no doubt that most investors say it is a tech company first and foremost.
Since, Apple, Microsoft (NASDAQ:MSFT), Facebook (NASDAQ:FB) and Amazon are the 4 most widely held stocks, at about 20% of the total S&P market capitalization, it should be no shock that they, along with Google (NASDAQ:GOOGL), are the most widely held stocks in almost every “tech” ETF.
Some may quibble that Facebook is really a communication company or an entertainment company but given the parameters in my initial paragraph no one can dispute that Facebook has changed lives, some might argue for the better, some for the worse. At any rate it is certainly a diversion for many and an obsessive diversion for some. Just look at the heat map and GOOGL, FB, MSFT, AMZN and AAPL will leap out as the highest-market-cap stocks in the US markets today.
No, Netflix (NASDAQ:NFLX) isn’t in there. It’s too small to be considered among the top 10, but Goofma (GFMAA) just didn’t roll off the tongue as easily as FANG.
Indeed, here’s a list of the Top 10 holdings of the $17 billion in assets of the Technology Select Sector SPDR (NYSE:XLK) and, beside it, the Top 10 in the $14 billion in assets Vanguard Information Technology (NYSE:VGT):
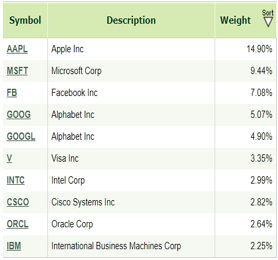
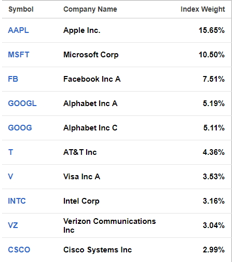
The only substantive difference between these two is that VGT doesn’t consider the nation’s two biggest wireless carriers, AT&T (NYSE:T) and Verizon Communications Inc (NYSE:VZ), to be tech stocks. I guess they figure keeping up with the broadest and fastest coverage makes them consumer services firms.
I’ll wager if I showed you another 25 tech ETFs, they too would have 60% of their portfolio in these same stocks. That’s what “market cap index” means, after all! Is it any wonder that many investors, when trying to decide between ETFs like this base their decision on which company has the lowest expenses? This has become almost a religion in the markets with this expert or that insisting you only invest with the crowd, i.e. in the biggest market cap companies, but then be ruthless about getting the lowest expense ratio.
If you are in this camp: Y’all do realize that on a $25,000 position the difference between 0.05% and 0.075% is a grand total of $6.25 per year held, right? This is what we call “decimal dust” on a position most will typically hold only until the next real decline makes them sell to protect what profit they still have – also known as a “Why Bother” (definition: 1 grande non-fat decaf no cinnamon latte).
If you want to stop obsessing over the $6.25 and instead add to your base technology ETF one with a very different approach, you might want to consider the First Trust NASDAQ-100 Tech Sector (NASDAQ:QTEC). It is admittedly a bit “weird” in its approach but weird can be good sometimes. Its performance has been right in line with the other bigger tech ETFs but with a very different crop of companies.
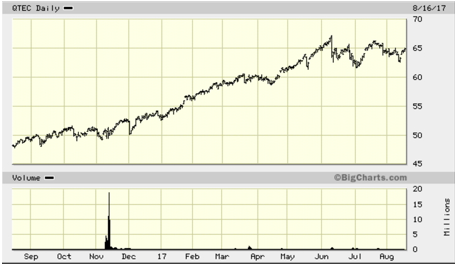
QTEC doesn’t have near the daily volume that big institutions need to wheel and deal (while telling you to go passive!) It’s total assets are just over $2 billion with average daily volume in the 220,000 - 230,000 range. It’s big enough to ensure liquidity but small enough to be a bit more nimble. QTEC’s top 10 holdings courtesy of www.xtf.com are:
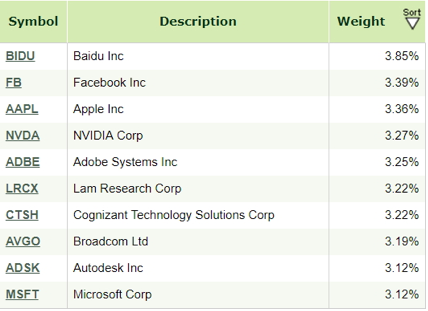
Ohmigosh! Where is Google? Where is Amazon? And who the heck is Broadcom Ltd (NASDAQ:AVGO) and Lam Research Corp (NASDAQ:LRCX)? Glad you asked.
The selection methodology for stocks in the QTEC portfolio is as follows:
- They needn’t be US-based firms, though most are, but they must be from among the 100 biggest NASDAQ firms classified as technology.›
- The index is reconstituted once a year following exactly the NASDAQ-100 reconstitution in December, but replacements may be made during the year if there is a replacement in the NASDAQ-100 Index.
- The index is an equal weighted index and is rebalanced four times annually in March, June, September and December.
This is an equal-weighted, not a cap-weighted, fund. The idea of rebalancing every 90 days to keep it balanced means if a particular company shoots way up and another plunges after missing 12-week earnings by a penny a share, the fund is forced to buy more shares of the one that is down and sell some shares of the one that has taken off.
If this constant regression to the mean included 500 stocks or 2000 stocks it wouldn’t work. There would be too many small-cap companies that skewed the results, probably unfavorably. But the NASDAQ 100 index (NDX) is comprised of just 100 of the largest non-financial companies and the subset of that, the NASDAQ 100 Technology Sector Index, currently is comprised of just 34 companies.
So QTEC deals with big firms but rebalances the total amount held in each one by regressing each to the mean of just under 3% every quarter. Regression to the mean could hurt performance relative to an individual stock like AAPL but it also means they are regularly buying low and selling high, albeit in small bites of the elephant each time.
The other thing it means is that they are only considering the 34 stocks (currently) that comprise the index so their mix is rather different than market-cap-only ETFs:

The backbone of science and technology is a bit more represented with QTEC. Social media and gaming are not a big part of the portfolio, but semiconductor companies, at 42%, and software developers, at 27%, are. I would argue these industries are the two least susceptible to changing and fickle consumer tastes but are instead the essential building blocks of the tech sector.
Oh and don’t forget this fund charges 0.6% per year, considerably more than the 0.1% of VGT and the 0.14% of XLK. I don’t see it as a replacement for the more traditional ETFs but as a very different adjunct – with very similar performance characteristics!
Disclaimer: (1) Do your due diligence! What's right for me may not be right for you. (2) Past performance is no guarantee of future results. Rather an obvious statement, but too many people look solely at past performance instead of seeking the alpha that comes from solid research and due diligence.
