Get 40% Off
👀 👁 🧿 All eyes on Biogen, up +4,56% after posting earnings. Our AI picked it in March 2024.
Which stocks will surge next?
Unlock AI-picked Stocks

Oil Trickles Lower As Gold Recovers

Published 04/25/2017, 12:17 AM
Updated 03/05/2019, 07:15 AM

Oil continued its downward grind overnight, gold recovered some of its losses as President Trump’s first 100-days draws to a close.

OIL

Oil continued its bullish unwind overnight, with both Brent and WTI spot contracts down just over 0.50%. Rising shale production and uncertainty over the OPEC deal extension being quoted as reasons for the fall. We continue to feel the primary cause is excessive short-term long positioning unwinding. In other words, the issues mentioned are known unknowns.

Nevertheless, in the bigger picture, both reasons are relevant. These should ensure any meaningful rallies in oil will be capped until the late May decision date.

Both Brent spot and WTI spot have opened in Asia near the previous session’s lows. Brent spot trades at 51.70 with support nearby at 51.30 and then its 200-day average at 50.80 followed by the 50.00 level. Resistance sits at 52.50 and 53.50.
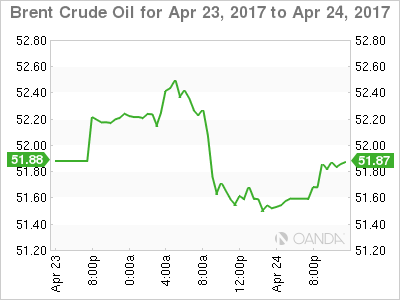
Brent Hourly Chart

WTI spot trades at 49.00, just above its 200-day average at 48.65, a break opening up a move to 47.00. Resistance sits at 50.00 and 51.00 a barrel.
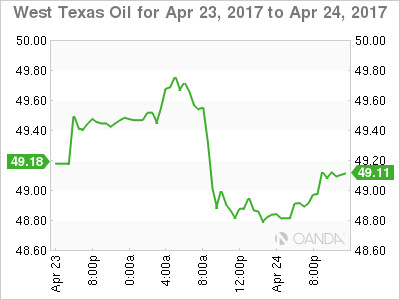
WTI Hourly Chart

GOLD

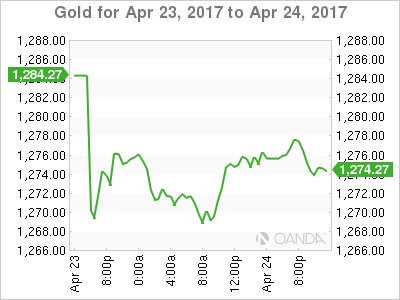
Gold recovered some of its post-election sell-off overnight to open roughly mid-range at 1278 this morning in Asia. With the election fading from memory rapidly the market now turns its attentions to President Trump’s legislative agenda.

Although news of a 15% corporate tax rate will no doubt be warmly received, the worries over a potential U.S. government shutdown seem to be taking precedence in traders’ minds. This has probably been gently supportive of gold overnight. We expect this issue to be more of a storm in a teacup given the soothing noises from Republican leaders this week.
3rd party Ad. Not an offer or recommendation by Investing.com. See disclosure here or remove ads .

Gold Hourly Chart

Gold itself, however, is still not showing a rosy picture technically with the potential of a decent downside correction if and when uncertainty fades. Gold has resistance at 1290 and then 1296, having failed in this area numerous times last week. Below, support lies at 1265.50 and then the 200-day average at 1254.80. A daily close below 1240 would signal a much larger correction could be on the way.

Original post

Latest comments

Bro, I think you got ahead of your self a bit.
I do not like thoose charts, can see you point in moore than One way..
fake news
Risk Disclosure: Trading in financial instruments and/or cryptocurrencies involves high risks including the risk of losing some, or all, of your investment amount, and may not be suitable for all investors. Prices of cryptocurrencies are extremely volatile and may be affected by external factors such as financial, regulatory or political events. Trading on margin increases the financial risks.
Before deciding to trade in financial instrument or cryptocurrencies you should be fully informed of the risks and costs associated with trading the financial markets, carefully consider your investment objectives, level of experience, and risk appetite, and seek professional advice where needed.
Fusion Media would like to remind you that the data contained in this website is not necessarily real-time nor accurate. The data and prices on the website are not necessarily provided by any market or exchange, but may be provided by market makers, and so prices may not be accurate and may differ from the actual price at any given market, meaning prices are indicative and not appropriate for trading purposes. Fusion Media and any provider of the data contained in this website will not accept liability for any loss or damage as a result of your trading, or your reliance on the information contained within this website.
It is prohibited to use, store, reproduce, display, modify, transmit or distribute the data contained in this website without the explicit prior written permission of Fusion Media and/or the data provider. All intellectual property rights are reserved by the providers and/or the exchange providing the data contained in this website.
Fusion Media may be compensated by the advertisers that appear on the website, based on your interaction with the advertisements or advertisers.
© 2007-2024 - Fusion Media Limited. All Rights Reserved.