Get 40% Off
⚠ Earnings Alert! Which stocks are poised to surge?
See the stocks on our ProPicks radar. These strategies gained 19.7% year-to-date.
Unlock full list

Oil Chart: First $64.81 Then Sub $20

Published 02/19/2017, 03:19 PM
Updated 07/09/2023, 06:32 AM

Lately, it seems like bearish stock pile builds can't knock the price oil down.

OPEC

In this alternate reality we’re living in, OPEC is NOT cheating. I have to admit, I didn’t see that coming. However with prices being propped up, we’re domestically producing almost 9M bpd again. The by-product is swelling inventories.

Will OPEC have to prolong their output cuts; or maybe even reduce further?

Many say this is the main reason for price still being in the $50’s given that we have had some massive builds as of late.

$64.81 First, Then Sub $20’s

Maybe traders believe OPEC will announce further cuts and price can continue to advance. We concur, however not for those reasons. We believe sentiment is bullish enough to take oil into the $60’s (Specifically $64.81) .

After that, our analysis shows a final descent into the sub $20 level. For us to revisit our oil count, price will have to exceed $66.87.
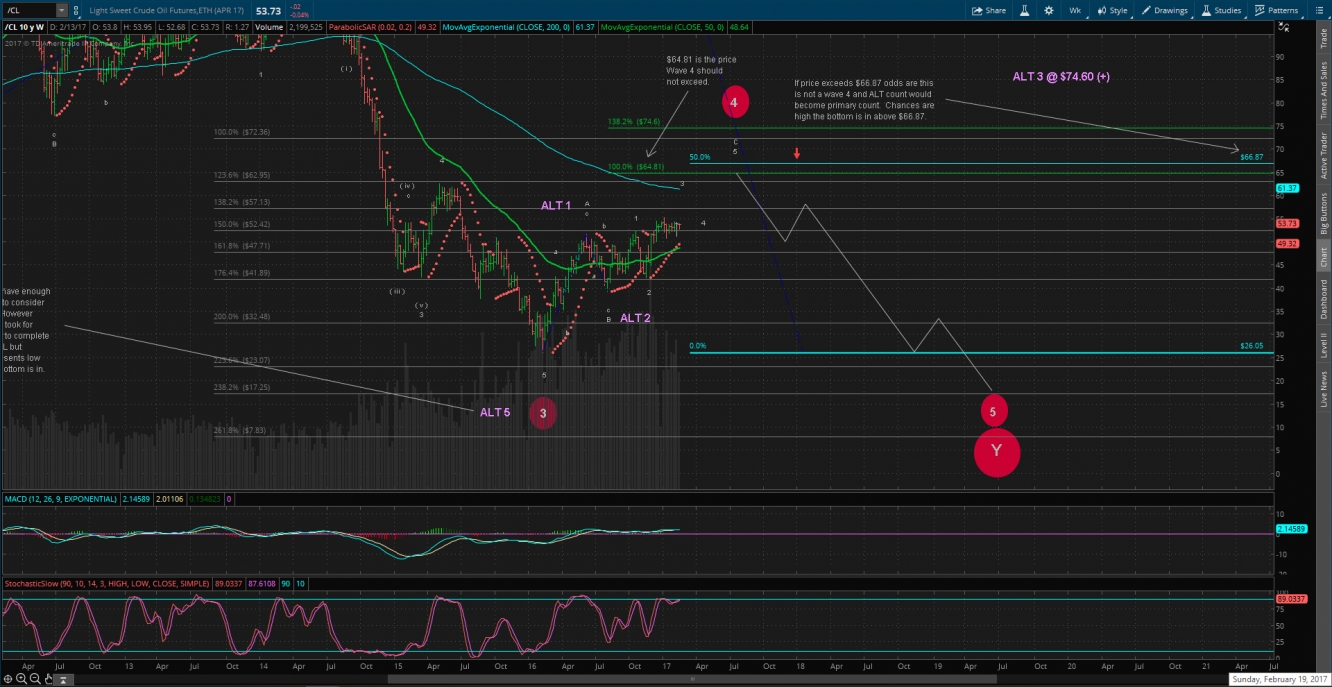
Oil Weekly Chart

Latest comments

Risk Disclosure: Trading in financial instruments and/or cryptocurrencies involves high risks including the risk of losing some, or all, of your investment amount, and may not be suitable for all investors. Prices of cryptocurrencies are extremely volatile and may be affected by external factors such as financial, regulatory or political events. Trading on margin increases the financial risks.
Before deciding to trade in financial instrument or cryptocurrencies you should be fully informed of the risks and costs associated with trading the financial markets, carefully consider your investment objectives, level of experience, and risk appetite, and seek professional advice where needed.
Fusion Media would like to remind you that the data contained in this website is not necessarily real-time nor accurate. The data and prices on the website are not necessarily provided by any market or exchange, but may be provided by market makers, and so prices may not be accurate and may differ from the actual price at any given market, meaning prices are indicative and not appropriate for trading purposes. Fusion Media and any provider of the data contained in this website will not accept liability for any loss or damage as a result of your trading, or your reliance on the information contained within this website.
It is prohibited to use, store, reproduce, display, modify, transmit or distribute the data contained in this website without the explicit prior written permission of Fusion Media and/or the data provider. All intellectual property rights are reserved by the providers and/or the exchange providing the data contained in this website.
Fusion Media may be compensated by the advertisers that appear on the website, based on your interaction with the advertisements or advertisers.
© 2007-2024 - Fusion Media Limited. All Rights Reserved.