Get 40% Off
🚨 Volatile Markets? Find Hidden Gems for Serious OutperformanceFind Stocks Now

Oil And Gold Slip Sideways Into Friday

Published 04/28/2017, 01:54 AM
Updated 03/05/2019, 07:15 AM

Crude oil staged a dead cat bounce overnight after an initial sell-off, whilst gold flat-lined into Friday.

Both Brent and WTI fell a dollar overnight to make new lows for the week but rebounded aggressively to finish unchanged from Wednesday at 51.50 and 48.90 respectively. Although the talk was of renewed Libyan production, the price action looks suspiciously stop loss driven in our opinion as both broke weekly lows flushing out yet more long-suffering bulls.

Oil’s recovery was probably helped by the International Energy Agency announcing that final investment decisions in new fields had dropped to the lowest level since the 1940’s. That will be a story for another day, more interestingly from a technical standpoint was that both contracts broke their 200-day moving averages intra-day, only to close back then as the New York session ended. Although crude has had something of a dead cat bounce, it may imply we have seen the worst of the sell-off for this week at least.

BRENT

Brent spot opens at 51.50 this morning with support at the 200 DMA at 50.90 followed by the overnight low at 50.0 and then 49.50. Resistance lies just above at 51.80 and then 52.50.
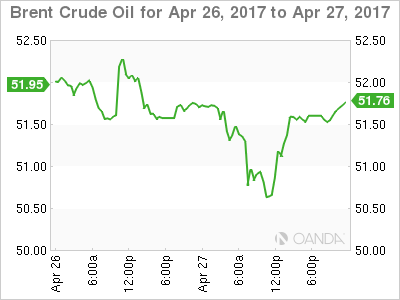
Brent Chart For April 26-27

WTI

WTI spot trades at 48.85 with its 200 DMA just below at 48.70, followed by its overnight low at 47.90 and then 46.50. Resistance is just above at 49.00 and then the 50.00 a barrel region.
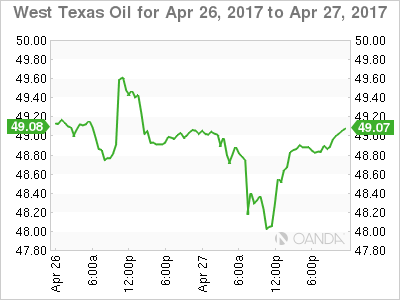
WTI Chart For April 26-27

GOLD

Gold heads into the end of the week with more of a whimper than a roar after a deadly quiet session overnight, closing almost unchanged at 1264.50 where it presently trades in Asia. The price action though continues to suggest that gold is treading water before another move down rather than a rally.

3rd party Ad. Not an offer or recommendation by Investing.com. See disclosure here or remove ads .

With the world an apparently more certain place, the safe haven bid is dissipating which could slowly but surely erode gold’s pricing premium, and a stronger U.S. dollar against the G10 currencies will not be helping.

From a technical perspective, gold has continued to make lower highs on a daily basis over the last two weeks. Gold has initial support at 1259.50 and then the 200-day moving average at 1253.70. The key support region follows this at 1240, a break of which would imply possibly much lower levels.

Resistance lies at 1270 followed by 1280 and then the April highs at 1295.70.
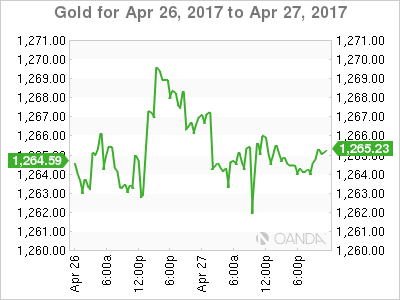
Gold Chart For April 26-27

Original post

Latest comments

Thank you very much Market Pulse, hope you all have a Great weekend.
Risk Disclosure: Trading in financial instruments and/or cryptocurrencies involves high risks including the risk of losing some, or all, of your investment amount, and may not be suitable for all investors. Prices of cryptocurrencies are extremely volatile and may be affected by external factors such as financial, regulatory or political events. Trading on margin increases the financial risks.
Before deciding to trade in financial instrument or cryptocurrencies you should be fully informed of the risks and costs associated with trading the financial markets, carefully consider your investment objectives, level of experience, and risk appetite, and seek professional advice where needed.
Fusion Media would like to remind you that the data contained in this website is not necessarily real-time nor accurate. The data and prices on the website are not necessarily provided by any market or exchange, but may be provided by market makers, and so prices may not be accurate and may differ from the actual price at any given market, meaning prices are indicative and not appropriate for trading purposes. Fusion Media and any provider of the data contained in this website will not accept liability for any loss or damage as a result of your trading, or your reliance on the information contained within this website.
It is prohibited to use, store, reproduce, display, modify, transmit or distribute the data contained in this website without the explicit prior written permission of Fusion Media and/or the data provider. All intellectual property rights are reserved by the providers and/or the exchange providing the data contained in this website.
Fusion Media may be compensated by the advertisers that appear on the website, based on your interaction with the advertisements or advertisers.
© 2007-2024 - Fusion Media Limited. All Rights Reserved.