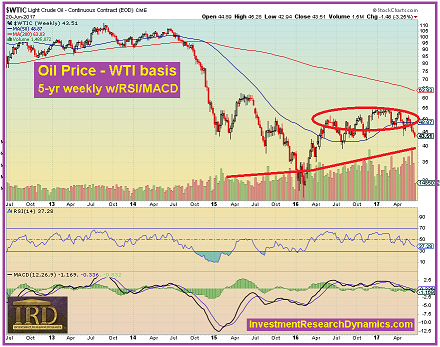
The falling price of oil did not garner any mainstream financial media attention until today, when U.S. market participants woke up to see oil (both WTI and brent) down nearly $2. WTI briefly dropped below $43. The falling price of oil reflects both supply and demand dynamics. Demand at the margin is declining, reflecting a contraction in global economic activity which, I believe the data shows, is accelerating. Supply, on the other hand, is rising quickly as U.S. oil producers – specifically distressed shale oil companies – crank out supply in order to generate the cash flow required to service the massive energy sector debt load.
I am quite surprised by the rapid fall of oil (WTI basis) from the $50 level, because I concluded earlier this year that the Fed was attempting to “pin” the price of oil to $50:

The graph above is a 5-yr weekly of the WTI continuous futures contract. Oil bottomed out in early 2016 and had been trending laterally between the mid-$40’s and $55.
I read an analysis in early 2016 that concluded that junk-rated shale oil companies would implode if oil remained in the low $40’s or lower for an extended period of time. Note that some of the TBTF banks who underwrote shale junk debt were stuck with unsyndicated senior bank debt (i.e. they were unable to find enough investors to relieve the banks of this financial nuclear waste). Thus, the Fed has been working to keep the price of oil levitating in the high $40’s/low $50’s, in part, to prevent financial damage to the big banks who have big exposure to shale oil debt.
The problem for the Fed is that it can’t control the global supply of oil. There’s too many players. With oil pinned in that trading range, U.S. oil companies have been pumping out oil as quickly as possible. The oil drilling rig count has risen for 22 weeks – Oilpro.com – the longest consecutive streak since 1987. Rising production from the U.S. and elsewhere is keeping global stockpiles high, especially relative to demand.
As a result, you get chart of the price of oil that looks like the one above. Oil is now well below both the 50/200 dma plus the RSI and MACD are pointing straight south, indicating a high probability of lower prices for awhile. Also, note the rising volume in conjunction with the falling price. This is indicates that market participants have been and continues to be better sellers.
The Fed is thus unable to pin the price of oil to $50 on a sustainable basis. Why? Because it has no control over the global supply and demand, which prevents control the price of oil for any meaningful period of time (just ask OPEC about that). Similar to the Fed’s price-management of oil, the Fed has been keeping gold pinned under $1300 since early November in an effort to prevent a rising price of gold from undermining the dollar’s reserves status and signalling the escalating economic and financial distress in the U.S.
This is despite rising demand for physical gold coming from numerous eastern hemisphere countries. As long as the Fed (and western Central Banks) can continue delivering physical gold into the massive demand vortex in the eastern hemisphere, it can somewhat successfully manage the price.
Also similar to oil, the Fed has no control over the supply and demand of gold, except to the extent that the Fed/western Central Banks are still holding gold that can be leased out or custodial gold that can be hypothecated for the purpose of enabling a continuous flow of physically deliverable to gold the east. But the difference between oil and gold is that the supply of mined gold is relatively fixed (and has been over a long period of time).
At some point the western Central Banks will run out of access to enough gold that can be delivered to buyers who paid to settle their purchases upfront. At that point, the chart of the price of gold will look like the recent graph of bitcoin, ethereum, etc.
This brings up a quick point about the cryptocurrencies. When the U.S. blocked Iran’s access to the SWIFT trade settlement system, India began to pay for the oil it imports from Iran with gold.
These were very large-dollar transactions. We have yet to hear any reports of sovereign nations using Bitcoin or other cryptos for payment to settle trade agreements. For me, this highlights yet another difference between the use of gold as a currency vs the cryptos. I want to make it clear that I’m not in the anti-cryptocurrency camp, but I do believe that, ultimately, precious metals (gold and silver) are much more functional as a form of money than the cryptos. Bitcoin debuted for peer-to-peer transactions in 2009. Gold has functioned for this purpose for over 5,000 years. My preference in this situation is to bet big on the form of money that has pedigree
