A very dovish RBNZ slapped down the rate hikers today. Sending NZD down 1% with some interesting set-ups on the crosses as well.
The RBNZ announced it’s OCR today, leaving it unchanged at 1.75% and saying that any tightening might be at least two years away. The unchanged OCR was expected, what wasn’t, was the extremely dovish tone of the Central Bank afterwards. Post New Zealand’s stellar inflation expectations earlier this week, many in the market had started pricing hiking sooner than later, building 35 basis points into the curve by the end of 2017.
The Governor and Deputy Governor certainly did their best to take the wind out of that particular train of thought. The level of the NZD and the NZD TWI are clearly much bigger priorities for them at this stage, and they do not want to nip the emerging inflation bud too soon. (they have made this mistake before, by the way).
Looking at a selection of the headlines below,
RBNZ GOVERNOR SAYS IF HOUSE PRICE INFLATION STARTED TO PICK UP AGAIN, LINKED TO STRONG MIGRATION FLOWS, THEN WOULD “CERTAINLY BE LOOKING AT MACROPRUDENTIAL INTERVENTION" – source Reuters
08:19 (NZ) RBNZ Gov Wheeler: Slower house price inflation is good news; OCR likely to stay low – speaking at Parliament – Risks around OCR going up or down are evenly balanced.- Too early to say if house price moderation will be sustained.- Market got ahead of itself on pricing increases in OCR.
(NZ) RBNZ assistant Gov Mcdermott: To ensure 2% inflation before rate hiking – Uncomfortable with NZD level – More circumspect on positive news than market – There are continuous questions on possible US fiscal expansion- RBNZ has switched focus to external risks from domestic issues.
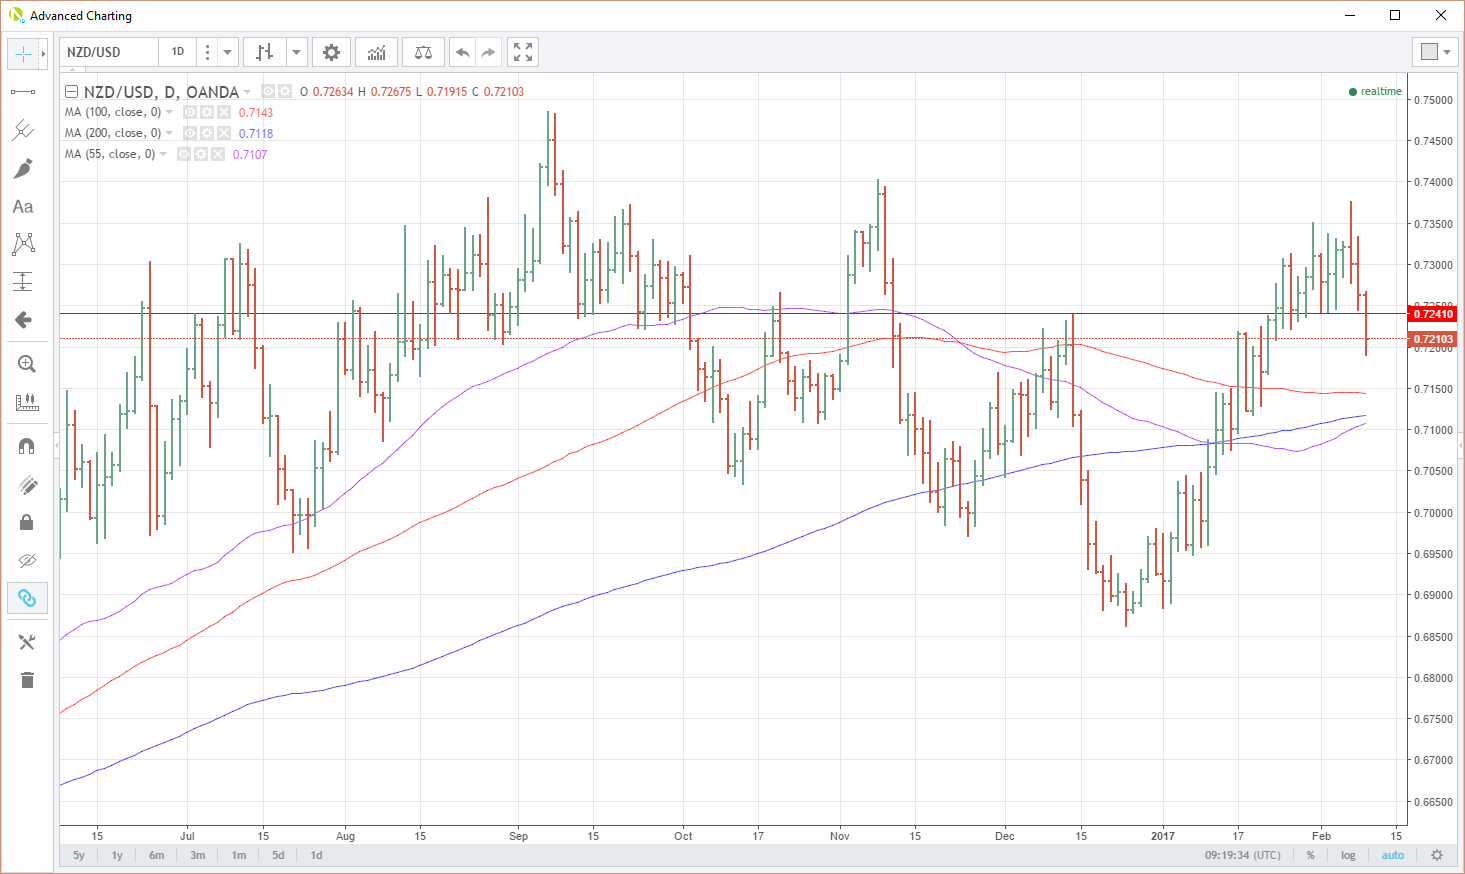
The tone is unequivocally dovish, and the NZD duly feel from 7320 to 7200 very rapidly. In the face of rising US rates this year, this could be the start of a meaningful pullback in NZD. A narrowing interest rate differential is eroding one of the perpetual reasons that NZD finds support on extended dips. This has left some interesting setups on the NZD charts, particularly some of the crosses.
A massive reversal of fortunes from the dizzy heights of 7375 a few days ago. Resistance is now the previous support at 7240 followed by 7270. Support is at 7188 and 7165. The key support region is between 7107 to 7143, containing the 55, 100 and 200-day moving averages.

NZD/USD Daily
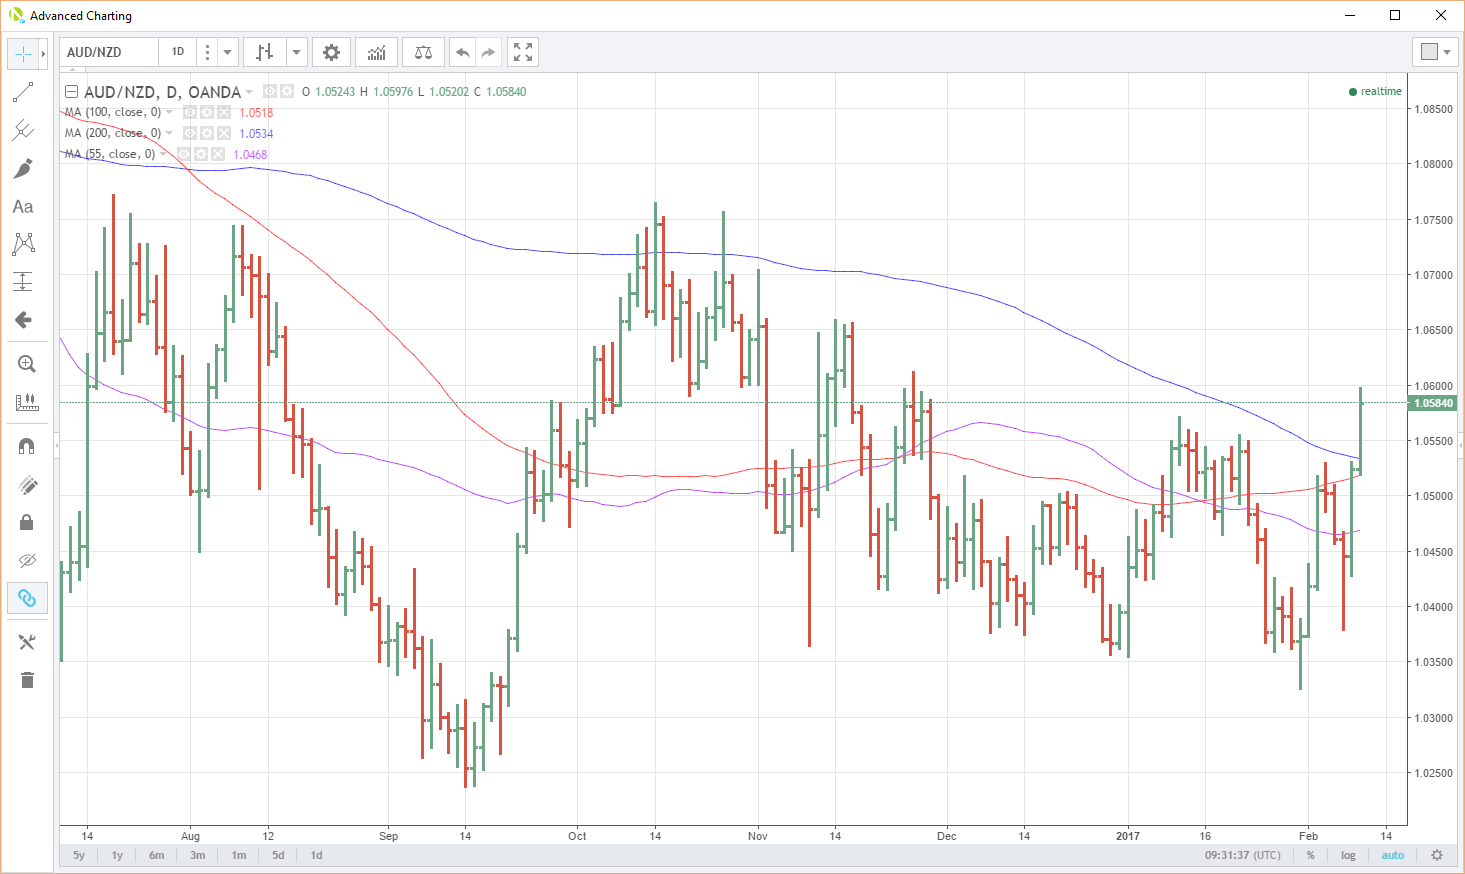
AUD has been the perennial bridesmaid against the NZD lately. From a trading point of view there is a lot more bad news priced into the AUD at the moment then there is the NZD, leaving the later exposed. From a personal point of view, over the years, it has always been a dangerous business in history selling AUD/NZD at or near 1.0300. History is littered with traders who have started talking parity and done just that. Myself included.
AUD/NZD has taken out its 55, 100 and 200-day moving averages in the space of 24 hours and should be respected technically.
Minor resistance is just above here at 1.0610 with a multi-day series of tops in the 1.0660 region. Support now is at 1.0535 the 200 DMA and 1.0520 the 100 DMA.

AUD/NZD Daily
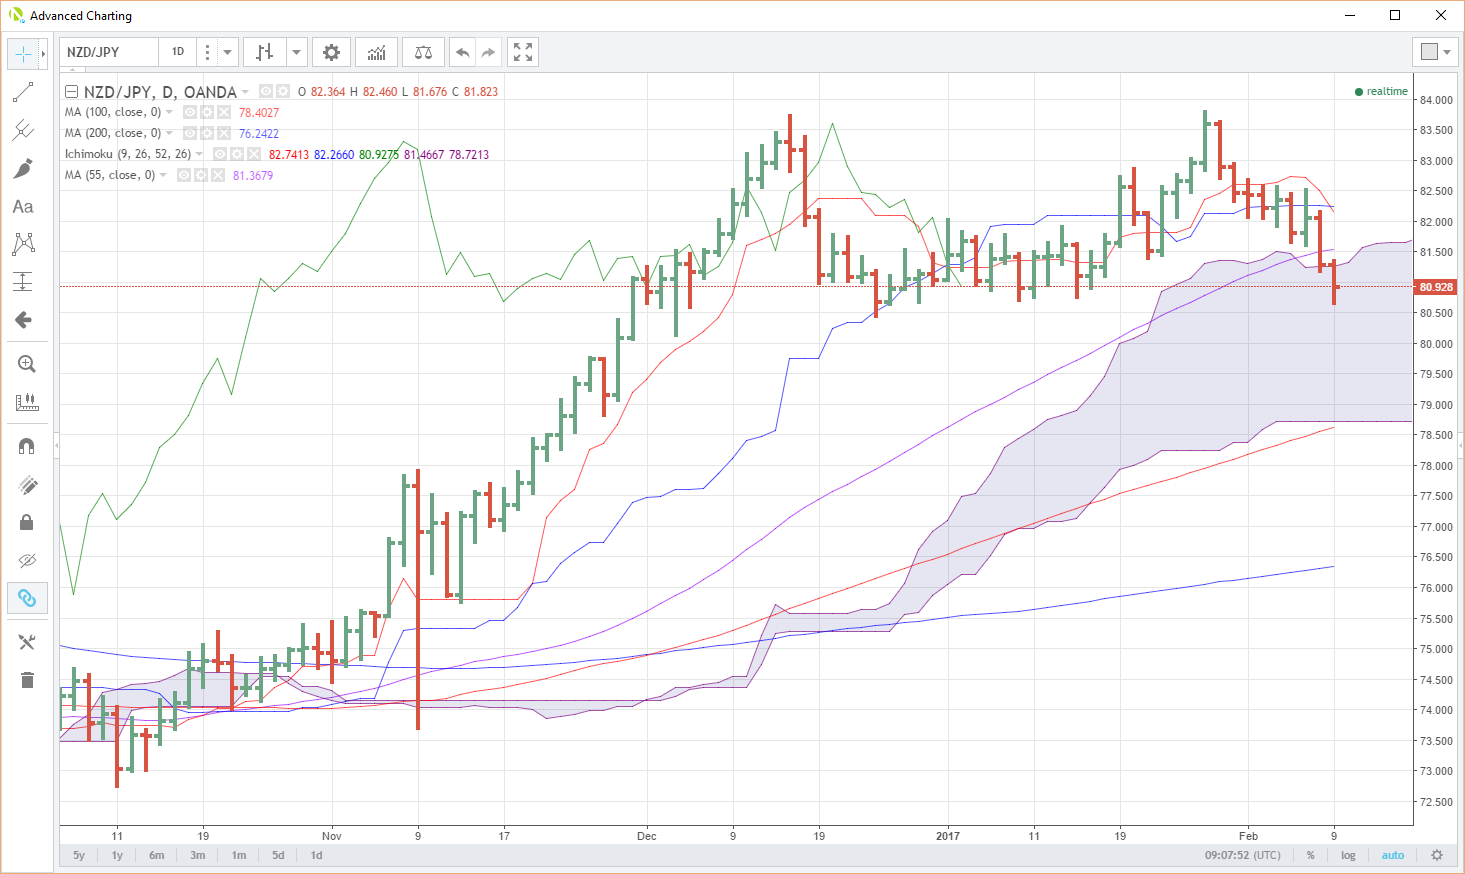
Has been on a downtrend for the last week or so. Today it broke the 55 DMA at 81.55 and the top of the ichi-moko cloud at 81.30. These now become resistance.
A break of 80.65 (multiple previous daily closes) signals a possible technical move to the base of the cloud and the 100 DMA at 78.60/78.75 area. A daily close inside the cloud should be respected by traders from a technical perspective.
From a longer-term point of view, the cross now has a very well defined double top at 83.80.

NZD/JPY Daily
XAU/NZD
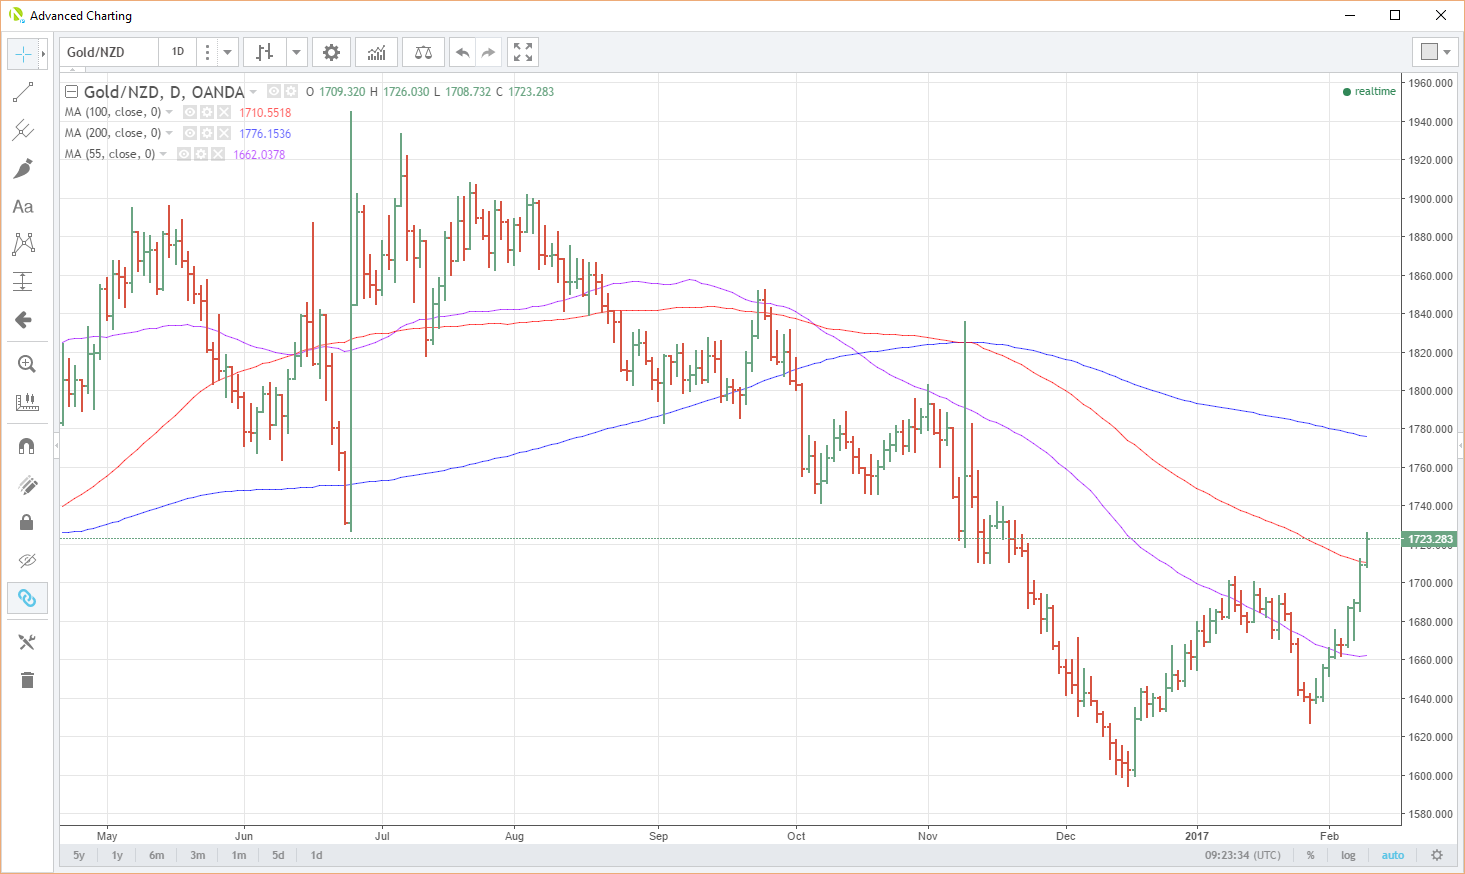
A more esoteric pair for sure, but an intriguing chart after today’s NZD/USD move. Clearly, gold has been bid against just about everything as perceived turmoil in the world sends safe haven flows its way.
Today’s session, though, has taken out the 100 DMA at 1710, potentially setting up a move to the 200 DMA at 1176.15. I note on this chart that whenever this cross appears to break the 100 DMA in recent times, it tends to move on to the 200 DMA.
Another interesting point is that the top of the daily ichi-moko was also broken today at 1715 (near the 100 DMA). Superimposing this on the chart below makes it look too “busy” for my liking but traders are free to do so on their systems. What is particularly interesting to me is that XAU/NZD has not been above the top of the cloud since August 2016.

XAU/NZD Daily
Summary
The RBNZ has sent New Zealand dollar currency and interest rate hawks to the naughty spot in no uncertain terms. It remains to be seen whether they are allowed back to have their dinner or not so to speak. The price action, however, on NZD has not been constructive today. 24 hours is a long time these days in the markets. A consolidation of the kiwi’s losses over the next few days could signal a much deeper correction is on the cards.
