Today, the president of the Federal Reserve Bank of San Francisco, John Williams, said that the US central bank should seek to raise rates, in particular, in order to reduce the risk of overheating of the economy. Previously, the Federal Reserve raised the key interest rate to a range of 1% -1.25%, saying it expects another rate hike this year. The Fed also presented a plan to reduce its balance, amounting to 4.5 trillion US dollars, later this year.
Nevertheless, the US dollar reacted sluggishly to Williams' statements. The market does not believe that the Fed can really proceed with further tightening of monetary policy amid weak data on inflation in the US.
So, Fed President St. Louis James Bullard on Friday said that the Fed can take a pause in tightening the policy, noting that "the recently published data on inflation presented a negative surprise and caused doubts in achieving the target level of inflation ... The Committee on Open Market Operations The US Federal Reserve can refrain from actions and analyze the development of the macroeconomic situation in the next quarters".
Other macro data from the US also come out with weaker indicators. So, published on Friday, the indicators of activity in the manufacturing and services sector of the US, calculated by IHS Markit, in June were marked by a decrease. The preliminary index of supply managers (PMI) for the US manufacturing sector in June fell to 52.1 against 52.7 in May, reaching a 9-month low. The preliminary index of supply managers (PMI) for the US service sector fell to a 3-month low, reaching 53 versus 53.6 in May. Values above 50 indicate an increase in activity; however, a decline in indicators may indicate a trend.
Today, market participants will follow the data on New Zealand's foreign trade balance for May, which are published at 21:45 (GMT). With positive data, the New Zealand dollar will receive additional support.
Technical analysis
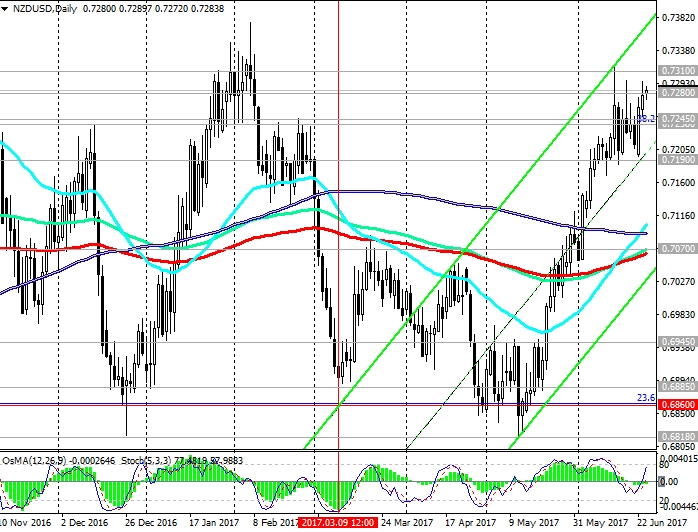
As a result of active growth, which began in the middle of last month, the pair NZD/USD broke through the strong resistance levels 0.7190 (EMA144 on the weekly chart), 0.7238 (Fibonacci level 38.2% upward correction to the global wave of the pair's decline from the level of 0.8800, which began in July 2014 Year, the low of December 2016) and is currently trading at the resistance level of 0.7280 (EMA200 on the weekly chart).
The NZD/USD pair maintains positive dynamics, while OsMA and Stochastic indicators on the daily, weekly, monthly charts are on the buyers’ side.
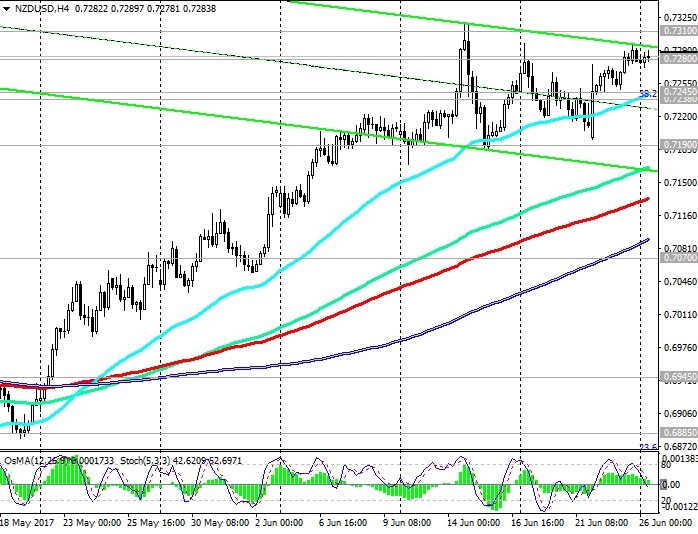
At the same time, the NZD/USD pair is in the zone of strong resistance levels of 0.7280, 0.7310 (the top line of the descending channel on the weekly chart), from which there may be a retreat and a decline in the channel.
In this regard, it is worth paying attention to the indicators OsMA and Stochastics, which on the 1-hour, 4-hour charts are deployed to short positions.
The breakdown of support levels of 0.7245 (EMA200 on the 1-hour chart), 0.7238 could trigger a further decline in the NZD/USD pair.
The difference between the monetary policies of RBNZ and the Fed is still a strong fundamental factor in favor of reducing the NZD/USD pair.
Support levels: 0.7245, 0.7238, 0.7190, 0.7165, 0.7100, 0.7070
Resistance levels: 0.7280, 0.7310, 0.7380, 0.7440


