
Novo Nordisk (CSE:NOVOb) A/S (NYSE:NVO) reported fourth-quarter 2019 earnings of 55 cents per American Depositary Receipt (ADR), matching the Zacks Consensus Estimate and increasing 5% in DKK from the year-ago quarter.
Revenues grew 9% year over year in DKK (up 6% at constant exchange rate [CER]) to $4.86 billion. Revenues beat the Zacks Consensus Estimate of $4.83 billion.
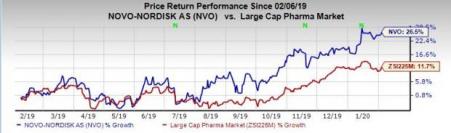
In the past year, Novo Nordisk’s shares have rallied 26.5%, outperforming the industry’s growth of 11.7%.
All growth rates mentioned below are on a year-over-year basis.
Quarter in Detail
Novo Nordisk operates in two segments — Diabetes and Obesity care, and Biopharmaceuticals.
The Diabetes and Obesity Care segment sales grew 7% at CER. Sales of insulin decreased 4% at CER to DKK 14,907 million. Sales of long-acting insulin (Tresiba, Xultophy and Levemir) declined 9% to DKK 5,102 million.
Sales at the Biopharmaceuticals segment rose 2% at CER to DKK 5,087 million. Hemophilia sales were up 1% to DKK 2,554 million.
Ozempic had a strong launch and recorded sales of DKK 4,365 million in the quarter.
Research and development (R&D) expenses declined 5% at CER, owing to the priority review voucher for Rybelsus in the fourth quarter of 2018.
Administrative costs decreased 3% at CER from the year-ago period.
Sales and distribution costs ascended 8% at CER, owing to resource allocation to the growth markets, promotional activities for Saxenda, launch activities for Ozempic and prelaunch activities for Tresiba in China.
Full-Year 2019 Update
The company recorded earnings of $2.46 for 2019, up 3% in DKK.
The company recorded sales of $18.3 billion, up 9% in DKK and 6% at CER
Other Updates
In January 2020, Ozempic was approved in the United States for cardiovascular (CV) risk reduction in people with Type II diabetes and established cardiovascular diseases. Rybelsus’ label in the United States was updated with additional information from the PIONEER 6 CV outcomes study. In the same month, Rybelsus was recommended for approval for the treatment of adults with Type II diabetes by the European regulatory authorities.
2020 Outlook
Novo Nordisk expects 3-6% sales growth at CER for 2020. This reflects a strong performance for the GLP-1-based diabetes care products Ozempic, Victoza and Rybelsus, the obesity care product Saxenda, the portfolio of new-generation insulin and the contribution from biopharm products Esperoct, Refixia and NovoEight.
However, this is expected to be partly offset by intensifying global competition within the Diabetes Care and Biopharmaceuticals segments, especially for hemophilia inhibitor.
Persistent pricing pressure within Diabetes Care, especially in the United States, might also negatively impact sales.
Our Take
Continued growth from Victoza and Tresiba, the strong launch of Ozempic and higher contributions from Saxenda should offset the impact of lower realized prices in the United States, loss of exclusivity for products in hormone replacement therapy and stiff rivalry within diabetes and biopharmaceuticals markets.
Novo Nordisk A/S Price, Consensus and EPS Surprise
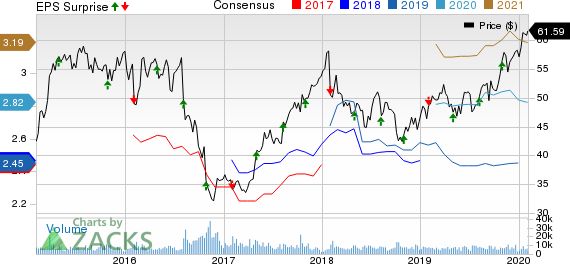
Novo Nordisk A/S price-consensus-eps-surprise-chart | Novo Nordisk A/S Quote
Zacks Rank & Stocks to Consider
Novo Nordisk currently has a Zacks Rank #4 (Sell).
A few better-ranked stocks from the healthcare space are Pfizer, Inc. (NYSE:PFE) , Sanofi (NASDAQ:SNY) and Roche Holding (SIX:ROG) AG (OTC:RHHBY) . While Pfizer sports a Zacks Rank #1 (Strong Buy), Sanofi and Roche carry a Zacks Rank #2 (Buy). You can see the complete list of today’s Zacks #1 Rank stocks here.
Pfizer’s earnings per share estimates have moved up from $2.62 to $2.77 for 2020 and from $2.73 to $2.81 for 2021 in the past 90 days. The company delivered a positive earnings surprise of 7.46%, on average, in three of the last four quarters.
Sanofi’s earnings per share estimates have moved up from $3.26 to $3.29 for 2019 and from $3.45 to $3.49 for 2020 in the past 60 days. The company delivered a positive earnings surprise of 8.25%, on average, in the last four quarters.
Roche’s earnings per share estimates have increased from $2.61 to $2.66 for 2020 and from $2.82 to $2.85 for 2021 in the past 60 days.
Biggest Tech Breakthrough in a Generation
Be among the early investors in the new type of device that experts say could impact society as much as the discovery of electricity. Current technology will soon be outdated and replaced by these new devices. In the process, it’s expected to create 22 million jobs and generate $12.3 trillion in activity. A select few stocks could skyrocket the most as rollout accelerates for this new tech. Early investors could see gains similar to buying Microsoft (NASDAQ:MSFT) in the 1990s. Zacks’ just-released special report reveals 8 stocks to watch. The report is only available for a limited time.
See 8 breakthrough stocks now>>
Pfizer Inc. (PFE): Free Stock Analysis Report
Novo Nordisk A/S (NVO): Free Stock Analysis Report
Roche Holding AG (RHHBY): Free Stock Analysis Report
Sanofi (SNY): Free Stock Analysis Report
Original post
Zacks Investment Research