Get 40% Off
🚨 Volatile Markets? Find Hidden Gems for Serious OutperformanceFind Stocks Now

Not A Secular Bull, Maybe Just A Steer

Published 03/24/2014, 12:23 AM
Updated 07/09/2023, 06:31 AM

This is another post in the series about the question of whether we are experiencing a brand new secular bull market (see New all-time highs = Secular bull?).

P/Es are elevated

The struggle I've had is that secular bulls typically don't start at these kinds of elevated valuation levels. Here is a chart of S&P 500 P/E ratios from Chart of the Day that goes back to the start of the 20th Century. Note that P/E ratios are at the top of their historical range, especially if we were to exclude the anomalous episodes of the Tech Bubble period and the Lehman Crisis.
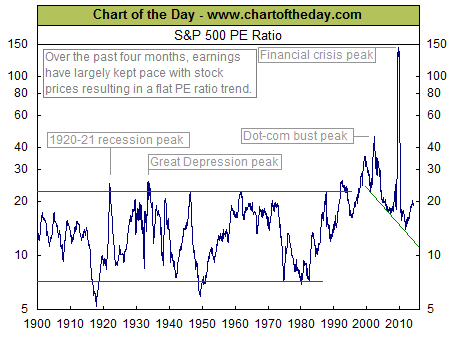
SPX P/E Ratios
In short, P/E ratios are elevated today. They aren't stupidly high, but there is no question that they are above average. As another point of reference, James Montier of GMO (via Zero Hedge) believes that the stock market is 50-70% overvalued. A 50-70% adjustment would put the P/E ratio in the low teens - which is roughly in the middle of the historical range.

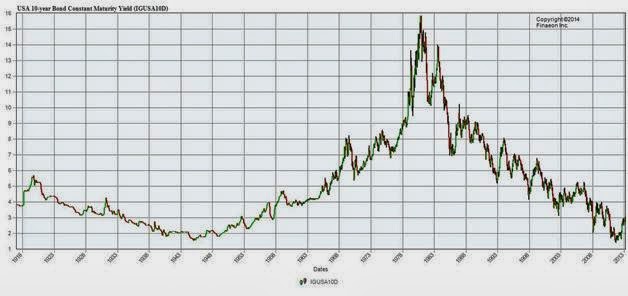
What about interest rates? The inverse of P/E is E/P, or earnings yield, which should be compared to the prevailing interest rates of the time. (This approach, by the way, forms the theoretical basis for the so-called Fed Model.) Here is a chart of 10-year Treasury yields going back to 1918, courtesy of Global Financial Data. The other comparable episode of low bond yields occurred during the period from the late 1930's to the mid-1950's.

 
10 year Treasury yields
10 Year Treasury Yields
 
3rd party Ad. Not an offer or recommendation by Investing.com. See disclosure here or remove ads .
The late 1930's to early 1950's analogue

Now look at this long term chart of the Dow. The stock market was range bound for most of that period until a new secular bull was launched about 1952:
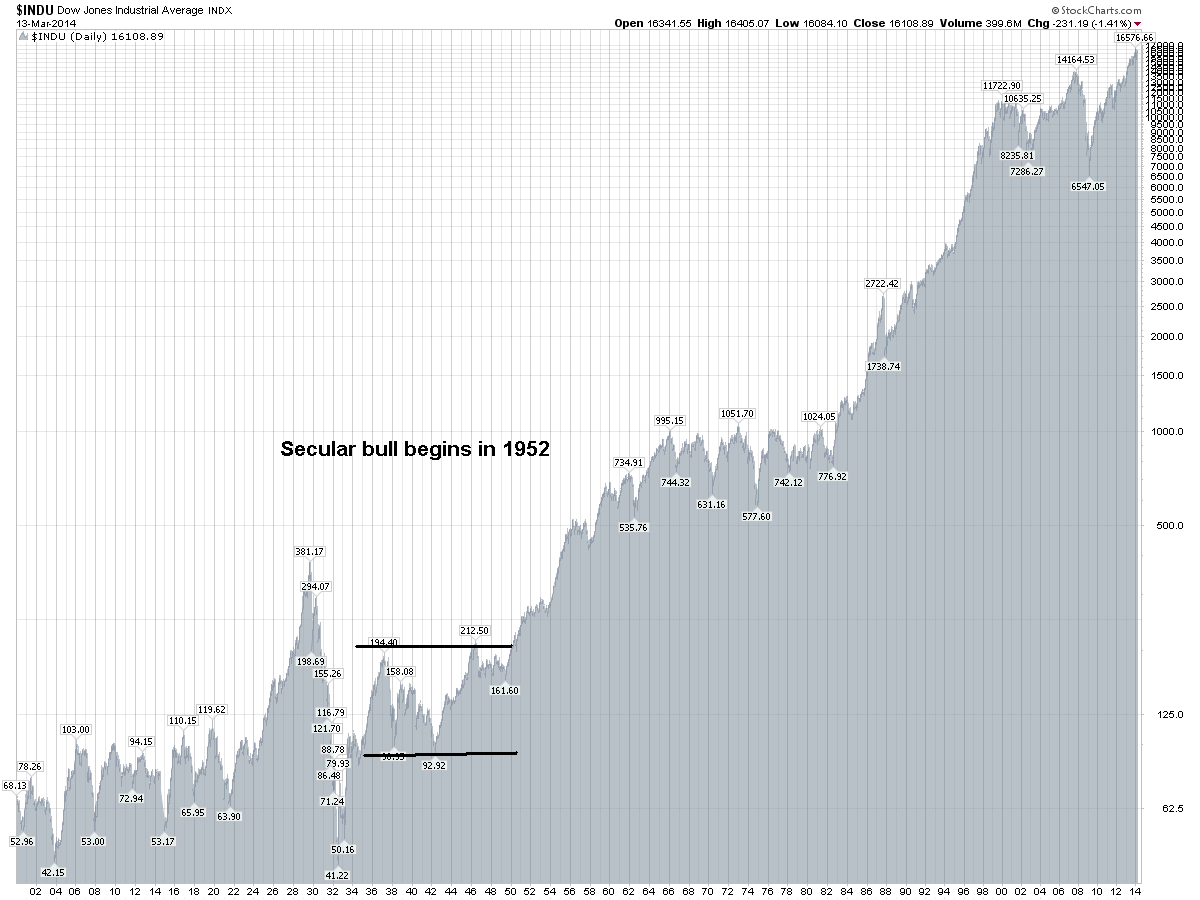
 
Dow Jones Industrial Average
DJIA since 1900
Here's my problem. The early 1950's were marked by extremely low P/E ratios in the single digit range, while today we are seeing P/Es in the high teens. The early 1950's was marked by a low interest rate regime, just as we have today. If this is truly the start of a new secular bull, how can we expect stock market gains that are typically seen in past episodes?

In my last post on this topic, I wrote:

When he puts it all together, my inner investor thinks that, if we are indeed seeing a new secular bull market, the extraordinary measures undertaken by global central banks in the wake of the Lehman Crisis has front-end loaded many of the gains to be realized in this bull.

True, the major averages have convincingly broken out to new all-time highs and it looks like a secular bull from a technician's viewpoint. However, valuation analysis suggests that this market is unlikely to see the same kinds of gains.

This market isn't a bull. It is, at best, a secular steer.

Disclosure: Cam Hui is a portfolio manager at Qwest Investment Fund Management Ltd. (“Qwest”). The opinions and any recommendations expressed in the blog are those of the author and do not reflect the opinions and recommendations of Qwest. Qwest reviews Mr. Hui’s blog to ensure it is connected with Mr. Hui’s obligation to deal fairly, honestly and in good faith with the blog’s readers.”

None of the information or opinions expressed in this blog constitutes a solicitation for the purchase or sale of any security or other instrument. Nothing in this blog constitutes investment advice and any recommendations that may be contained herein have not been based upon a consideration of the investment objectives, financial situation or particular needs of any specific recipient. Any purchase or sale activity in any securities or other instrument should be based upon your own analysis and conclusions. Past performance is not indicative of future results. Either Qwest or I may hold or control long or short positions in the securities or instruments mentioned.

3rd party Ad. Not an offer or recommendation by Investing.com. See disclosure here or remove ads .

Latest comments

Against all odds the DJIA will rise to new highs of 17000 to 17400 before a real crash phase next month. mark this words.
Risk Disclosure: Trading in financial instruments and/or cryptocurrencies involves high risks including the risk of losing some, or all, of your investment amount, and may not be suitable for all investors. Prices of cryptocurrencies are extremely volatile and may be affected by external factors such as financial, regulatory or political events. Trading on margin increases the financial risks.
Before deciding to trade in financial instrument or cryptocurrencies you should be fully informed of the risks and costs associated with trading the financial markets, carefully consider your investment objectives, level of experience, and risk appetite, and seek professional advice where needed.
Fusion Media would like to remind you that the data contained in this website is not necessarily real-time nor accurate. The data and prices on the website are not necessarily provided by any market or exchange, but may be provided by market makers, and so prices may not be accurate and may differ from the actual price at any given market, meaning prices are indicative and not appropriate for trading purposes. Fusion Media and any provider of the data contained in this website will not accept liability for any loss or damage as a result of your trading, or your reliance on the information contained within this website.
It is prohibited to use, store, reproduce, display, modify, transmit or distribute the data contained in this website without the explicit prior written permission of Fusion Media and/or the data provider. All intellectual property rights are reserved by the providers and/or the exchange providing the data contained in this website.
Fusion Media may be compensated by the advertisers that appear on the website, based on your interaction with the advertisements or advertisers.
© 2007-2024 - Fusion Media Limited. All Rights Reserved.