
Driven by top-line strength, Northern Trust Corporation’s (NASDAQ:NTRS) first-quarter 2018 earnings per share of $1.58 compared favorably with $1.09 recorded in the year-ago quarter. The Zacks Consensus Estimate was $1.42.
Higher revenues and credit provisions were the positives. In addition, the quarter witnessed rise in assets under custody (AUC) and assets under management (AUM). Moreover, credit metrics marked a significant improvement. However, escalating operating expenses remained a major drag.
Net income came in at $381.6 million compared with $276.1 million recorded in the prior-year quarter.
Margins & Revenues Improve, Costs Escalate
Total revenues of $1.48 billion surpassed the Zacks Consensus Estimate of $1.46 billion. Also, the figure improved 15% year over year.
On a fully-taxable equivalent basis, net interest income of $392.7 million was up 8% year over year. This was driven by elevated levels of average earning assets and higher net interest margin (NIM).
NIM was 1.38%, up 3 basis points from the prior-year quarter. The increase chiefly reflected higher short-term interest rate, partially offset by rise in premium amortization and a balance-sheet mix shift.
Non-interest income advanced 17% from the year-ago quarter to $1.09 billion. Rise in trust, investment and other servicing fees, along with foreign exchange trading income, security commissions and trading income, were the primary reasons for this upswing. These were partially offset by lower treasury management fees, other operating income and investment security losses.
Non-interest expenses flared up 11% year over year to $995.3 million in the quarter. The rise was mainly driven by an increase in all components of expenses.
Improvement in AUC & AUM
As of Mar 31, 2018, Northern Trust’s total AUC increased 14% year over year to $8.111 trillion while total AUM rose 16% to $1.16 trillion.
Credit Quality Improves
Total allowance for credit losses came in at $147.8 million, down 22% year over year. Non-performing assets decreased 31% to $128.9 million as of Mar 31, 2018. Also, credit provision was $3 million in the quarter compared with $1 million reported in the prior-year quarter.
However, net charge-offs were $3 million, up 50% from the year-ago quarter.
Strong Capital Position
Under the Advanced Approach, as of Mar 31, 2018, Tier 1 capital ratio, total capital ratio and Tier 1 leverage ratio came in at 14.4%, 16.2% and 7.6% compared with 14.2%, 15.6% and 8.2%, respectively, in the prior-year quarter. All ratios exceeded the regulatory requirements.
Capital Deployment Update
During the reported quarter, the company repurchased 2.5 million shares for $263.2 million at an average price of $104.51 per share. This includes shares related to share-based compensation.
Our Viewpoint
Results of Northern Trust display a decent performance in the reported quarter. We remain optimistic by the continued growth in AUC, revenues and an improving credit quality, to some extent. Furthermore, a positive impact of rising rates was visible. Though escalating expenses might pose a threat to the company’s profitability, benefits of tax reform are anticipated to act as a tailwind.
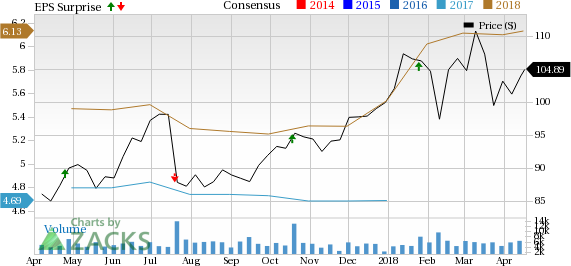
Northern Trust Corporation Price, Consensus and EPS Surprise
Northern Trust carries a Zacks Rank #3 (Hold). You can see the complete list of today’s Zacks #1 Rank (Strong Buy) stocks here.
Performance of Other Major Banks
Amid an expected weakness in investment banking, strong trading results, higher rates and lower tax rate drove JPMorgan’s (NYSE:JPM) first-quarter 2018 earnings of $2.37 per share, which handily outpaced the Zacks Consensus Estimate of $2.28. The reported figure was up 44% from the prior-year quarter.
The PNC Financial Services Group (NYSE:PNC) reported first-quarter 2018 earnings per share of $2.43 beating the Zacks Consensus Estimate by a penny. Moreover, the bottom line reflected a 24% increase from the prior-year quarter.
Despite dismal investment banking performance, higher interest rates, trading rebound and tax cuts drove Bank of America’s (NYSE:BAC) first-quarter 2018 earnings of 62 cents per share, which outpaced the Zacks Consensus Estimate of 59 cents. Also, the figure was 38% higher than the prior-year quarter.
Breaking News: Cryptocurrencies Now Bigger than Visa
The total market cap of all cryptos recently surpassed $700 billion – more than a 3,800% increase in the previous 12 months. They’re now bigger than Morgan Stanley (NYSE:MS), Goldman Sachs (NYSE:GS) and even Visa! The new asset class may expand even more rapidly in 2018 as new investors continue pouring in and Wall Street becomes increasingly involved.
Zacks has just named 4 companies that enable investors to take advantage of the explosive growth of cryptocurrencies via the stock market.
Click here to access these stocks. >>
JPMorgan Chase & Co. (JPM): Free Stock Analysis Report
The PNC Financial Services Group, Inc (PNC): Free Stock Analysis Report
Bank of America Corporation (BAC): Free Stock Analysis Report
Northern Trust Corporation (NTRS): Free Stock Analysis Report
Original post