
Nordson Corporation (NASDAQ:NDSN) reported better-than-expected results for second-quarter fiscal 2017 (ended Apr 30, 2017) with earnings and revenues beating estimates by 3.8% and 6%, respectively.
Adjusted earnings of $1.35 per share surpassed the Zacks Consensus Estimate of $1.30. Also, the bottom line surpassed the year-ago tally of $1.19 by 13.4%.
Sales generated in the quarter totaled $496.1 million, above the Zacks Consensus Estimate of $468.2 million. Also, the top line grew 13.4% year over year on the back of 9% growth in organic volumes and 6% gain from acquired assets, partially offset by 1.7% negative impact of currency translation.
Backlog was $403 million, up 37% year over year. Orders for the 12-week period ended May 14, increased 13% year over year.
On a regional basis, revenues sourced from the U.S. increased 18.9% year over year. Businesses in Japan, Asia Pacific and the Americas also improved, recording revenue increase of 5.1%, 22.9% and 8.2%, respectively. Top-line performance in Europe improved 2%.
Segmental Revenues
Nordson reports its top-line results under three segments, namely, Adhesive dispensing systems, Advanced technology systems and Industrial coating systems. A brief discussion on the segmental performance is provided below:
Adhesive dispensing systems segment generated revenues of $226.9 million, up 2.7% year over year. The Advanced technology systems segments’ revenues totaled approximately $210.1 million, up 32.5% year over year. Revenues generated from the Industrial coating systems segment increased 1.8% to $59.1 million.
Margins
In the quarter, Nordson’s cost of sales increased 16.6% year over year, representing 44.5% of total revenue compared with 43.2% in the year-ago quarter. Selling and administrative expenses, as a percentage of total revenue was 34.7% compared with 33.5% in the year-ago quarter.
Operating profits increased 1.6% year over year while the margin came in at 20.9%.
Balance Sheet & Cash Flow
Exiting the fiscal second quarter, Nordson had cash and marketable securities of $88.4 million, higher than $87.7 million recorded in the preceding quarter. The company’s long-term debt was $1,574.2 million, rising 72.5% from $912.4 million at previous-quarter end.
In the quarter, the company’s net cash generated from operating activities decreased 21.7% year over year to $61.4 million while capital spent on addition of property, plant and equipment increased 17.5% to $17 million.
During the quarter, the company paid dividends of approximately $15.5 million to its shareholders.
Outlook
For third-quarter fiscal 2017, Nordson anticipates sales to increase in the range of 15−19%. Organic growth is predicted within 6−10%. Acquisition gains will likely lead to 10% sales growth, offset by 1% negative impact from adverse foreign currency movements. Operating margin will likely be 24%.
GAAP earnings are expected in the range of $1.51−$1.65 per share.
Nordson Corporation Price and Consensus
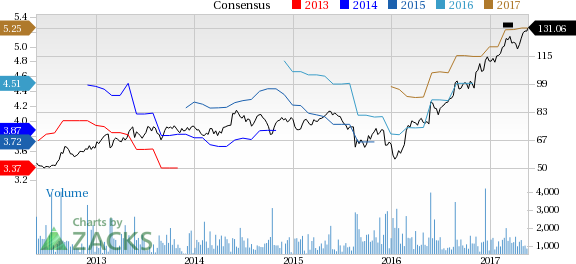
Nordson Corporation Price and Consensus | Nordson Corporation Quote
Zacks Rank and Key Picks
With a $7.5 billion market capitalization, Nordson currently carries a Zacks Rank #2 (Buy). Other stocks worth considering in the machinery industry include Applied Industrial Technologies, Inc. (NYSE:AIT) , Graco Inc. (NYSE:GGG) and Parker-Hannifin Corporation (NYSE:PH) . All these stocks sport a Zacks Rank #1 (Strong Buy). You can see the complete list of today’s Zacks #1 Rank stocks here.
Applied Industrial Technologies’ financial performance was impressive, with an average positive earnings surprise of 9.78% for the last four quarters. Also, earnings estimates for fiscal 2017 and fiscal 2018 were revised upward over the last 60 days.
Graco reported an average positive earnings surprise of 13.88%. Also, bottom-line expectations for 2017 and 2018 improved over the past 60 days.
Parker-Hannifin’s financial performance was impressive, with an average positive earnings surprise of 14.94% for the last four quarters. Also, earnings estimates for fiscal 2017 and fiscal 2018 were revised upward over the last 60 days.
Zacks' 2017 IPO Watch List
Before looking into the stocks mentioned above, you may want to get a head start on potential tech IPOs that are popping up on Zacks' radar. Imagine being in the first wave of investors to jump on a company with almost unlimited growth potential? This Special Report gives you the current scoop on 5 that may go public at any time.
One has driven from 0 to a $68 billion valuation in 8 years. Four others are a little less obvious but already show jaw-dropping growth. Download this IPO Watch List today for free >>
Parker-Hannifin Corporation (PH): Free Stock Analysis Report
Applied Industrial Technologies, Inc. (AIT): Free Stock Analysis Report
Graco Inc. (GGG): Free Stock Analysis Report
Nordson Corporation (NDSN): Free Stock Analysis Report
Original post
Zacks Investment Research