
Nokia (HE:NOKIA) Corporation (NYSE:NOK) reported mixed third-quarter 2019 financial results, wherein the top line beat the Zacks Consensus Estimate but the bottom line missed the same.
The company’s gross margin was impacted by product mix, a high cost level associated with its first generation 5G products, profitability challenges in China, pricing pressure in early 5G deals, and uncertainty related to the announced operator merger in North America.
Net Income
Reported profit for the quarter was €82 million ($91.2 million) or €0.01 (1 cent) per share against loss of €79 million or loss of €0.02 per share in the year-ago quarter. The improvement was mainly driven by progress in Nokia’s cost savings program and a gain on benefit plan amendments.
Non-IFRS profit came in at €264 million ($293.5 million) or €0.05 (6 cents) per share compared with €309 million or €0.06 per share in the prior-year quarter. The bottom line marginally missed the Zacks Consensus Estimate by 1 cent.
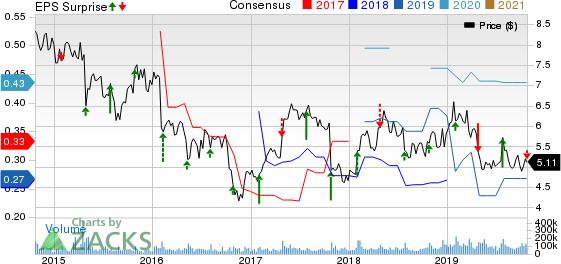
Nokia Corporation Price, Consensus and EPS Surprise
Sales
On reported basis, net sales for the September quarter increased 4.2% year over year to €5,686 million ($6,321 million). The performance was driven by improved industry demand and competitiveness of Nokia’s end-to-end portfolio, coupled with growth across four out of six regions and all customer types.
While net sales increased in Asia-Pacific, Europe, Latin America and North America (up 14%, 6%, 6% and 7%, respectively), it declined in Greater China and Middle East & Africa (down 21% and 7%, respectively).
Quarterly non-IFRS net sales grew 4.2% year over year to €5,688 million ($6,323.2 million), surpassing the consensus estimate of $6,307 million.
Segment Results
In Networks, net sales increased 4% year over year to €4,434 million ($4,929.2 million). This was driven by Mobile Access and IP Routing, partly offset by Fixed Access and Optical Networks. Growth in Mobile Access was due to 5G radio technologies and network deployment services, partly offset by decrease in legacy radio technologies. Growth in IP Routing was primarily due to the company’s market-leading portfolio and improved supply chain execution. The segment’s gross margin fell 500 basis points (bps) to 29.1%. Operating margin decreased 130 bps to 2.9%.
Net sales at Nokia Software were up 9% year over year to €677 million ($752.6 million), driven by the timing of completion and acceptance of certain projects, as well as improved product and go-to-market capabilities, with growth in both core networks and applications. The segment’s gross margin grew 460 bps to 52.9%. Operating margin jumped 1,100 bps to 23% mainly due to lower SG&A expenses, which was led by the integration and streamlining of core networks into Nokia’s existing specialized software salesforce.
Net sales at Nokia Technologies were up 2% year over year to €358 million ($398 million), primarily driven by higher one-time licensing sales. While the segment’s gross margin declined 190 bps to 97.8% due to a one-time sale of patent assets, its operating margin contracted 50 bps to 82.1%.
In Group Common and Other, net sales remained flat year over year at €236 million ($262.4 million). This reflects growth in Alcatel Submarine Networks primarily led by ramp-up of new projects, offset by a decline in Radio Frequency Systems due to absence of a large customer roll out. The segment’s gross margin was 3.4%, down 1,190 bps.
Other Details
Overall non-IFRS cost of sales increased to €3,682 million from €3,320 million year over year. Non-IFRS gross profit declined 6.3% year over year to €2,006 million. Non-IFRS operating profit was €478 million compared with €487 million in the year-ago quarter.
Further, Nokia has launched 15 live 5G networks with customers, including Sprint Corp. (NYSE:S) , Verizon Communications Inc. (NYSE:VZ) , AT&T Inc. (NYSE:T) and T-Mobile in the United States; Vodafone (LON:VOD) Italy and Zain in Saudi Arabia; as well as SKT, KT and LGU+ in Korea.
Cash Flow & Liquidity
During the first nine months of 2019, Nokia utilized €1,199 million of net cash in operating activities compared with cash utilization of €1,026 million in the year-ago period.
As of Sep 30, 2019, the Finnish telecom network equipment maker had €4,721 million ($5,153.6 million) in cash and equivalents with €4,063 million ($4,435.3 million) of long-term interest-bearing liabilities compared with the respective tallies of €4,799 million and €2,766 million a year ago.
Outlook Lowered
Due to margin pressure and additional 5G investments, Nokia has lowered its full-year 2019 and 2020 guidance. For 2019, the company currently expects non-IFRS earnings per share of €0.21 (+/- 3 cents), which was previously projected in the range of €0.25-€0.29. Non-IFRS operating margin is anticipated 8.5% (+/- 1 percentage point), clipped from earlier forecast of 9-12%.
For 2020, non-IFRS earnings per share are expected to be €0.25 (+/- 5 cents), previously anticipated in the range of €0.37-€0.42. Non-IFRS operating margin is likely to be 9.5% (+/- 1.5 percentage point), trimmed from previous estimate of 12-16%. The company expects long-term (3 to 5 years) non-IFRS operating margin between 12% and 14%.
Nokia currently carries a Zacks Rank #2 (Buy). You can see the complete list of today’s Zacks #1 Rank (Strong Buy) stocks here.
Conversion rate used:
€1 = $1.111672 (period average from Jul 1, 2019 to Sep 30, 2019)
€1 = $1.091626 (as of Sep 30, 2019)
Today's Best Stocks from Zacks
Would you like to see the updated picks from our best market-beating strategies? From 2017 through 2018, while the S&P 500 gained +15.8%, five of our screens returned +38.0%, +61.3%, +61.6%, +68.1%, and +98.3%.
This outperformance has not just been a recent phenomenon. From 2000 – 2018, while the S&P averaged +4.8% per year, our top strategies averaged up to +56.2% per year.
See their latest picks free >>
Nokia Corporation (NOK): Free Stock Analysis Report
Sprint Corporation (S): Free Stock Analysis Report
Verizon Communications Inc. (VZ): Free Stock Analysis Report
AT&T Inc. (T): Free Stock Analysis Report
Original post