Weak risk appetite extends to Asia
The reduced appetite for risk seen in the U.S. session yesterday continued through to Asia, with most equity indices in the red. The exception was the Australian 200 index, which rose marginally as ratings agency Fitch affirmed the ratings of Australia’s four major banks (a big portion of the index) with only National Australia Bank (AX:NAB) suffering a downgrade to the outlook from stable to negative.
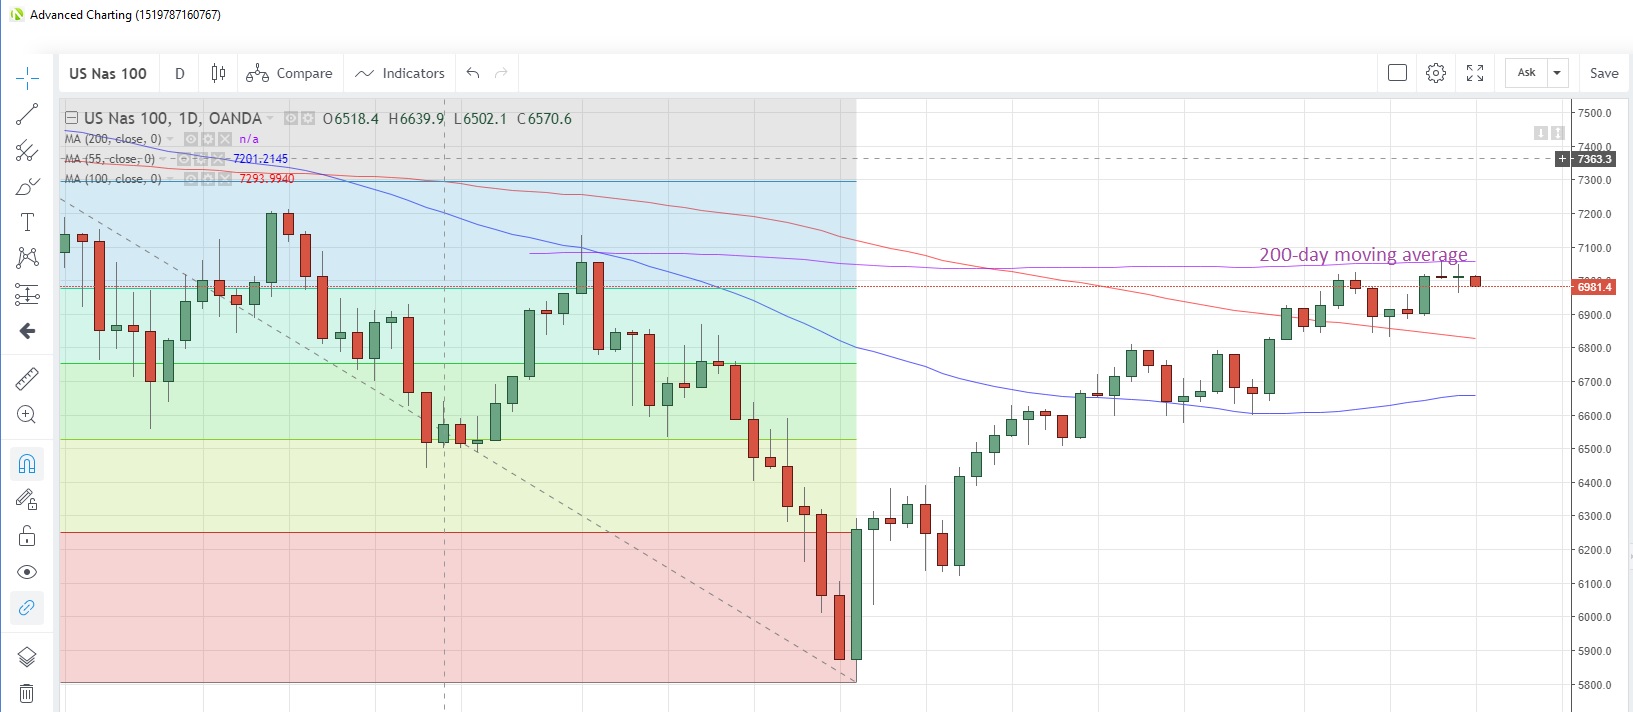
The US30 index slid 0.29% while the NAS 100 CFD sagged by 0.38% as the 200-day moving average at 7,057 capped the upside.
NAS100 Daily Chart
Source: OANDA fxTrade
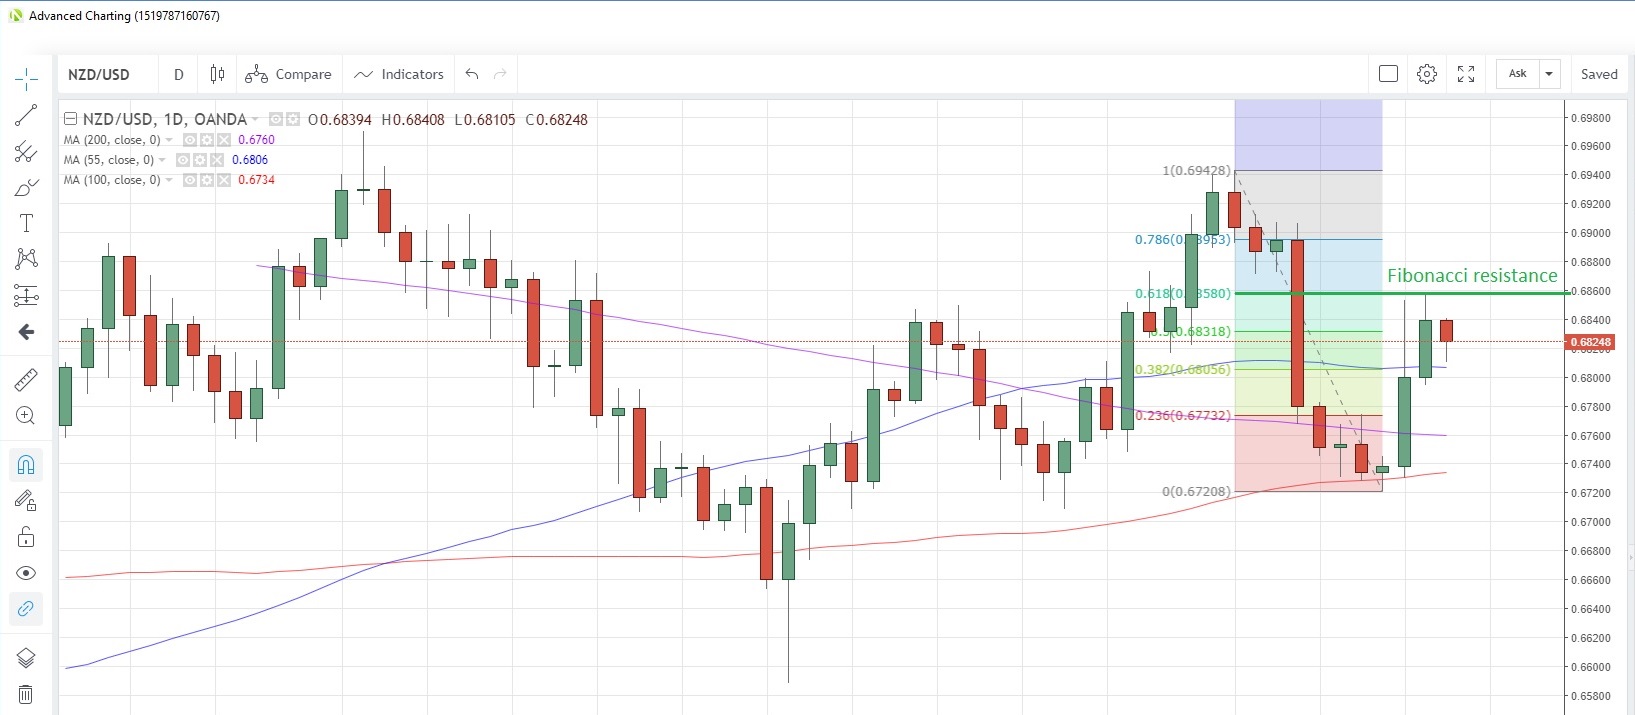
USD/JPY drifted downwards as the yen was bought on safe haven flows, while the beta-risk Aussie dollar edged lower toward the midpoint of this week’s range versus the U.S. dollar. Even the flying kiwi snapped a three-day winning streak versus the greenback, leaving the 61.8% Fibonacci retracement of the Feb. 1-12 drop at 0.6858 untouched.
NOTE: $1.34b worth of USD/JPY FX options expire today with strike of 110.00, according to DTCC data. USD/JPY is now at 110.30.
NZD/USD Daily Chart
Source: OANDA fxTrade
Singapore growth revised lower
Singapore’s economy expanded at a slower pace in Q4 2018 than had been previously estimated, the latest revision shows. GDP growth was an annualized 1.4% q/q and 1.9% compared to a year earlier versus prior estimates of +1.6% and +2.1%, respectively. An official from the Ministry of Trade and Industry said at a media briefing after the release that growth for this year will likely be below the midpoint of the 1.5% to 3.5% range, supported by the infocomm, education, health and social services sectors.
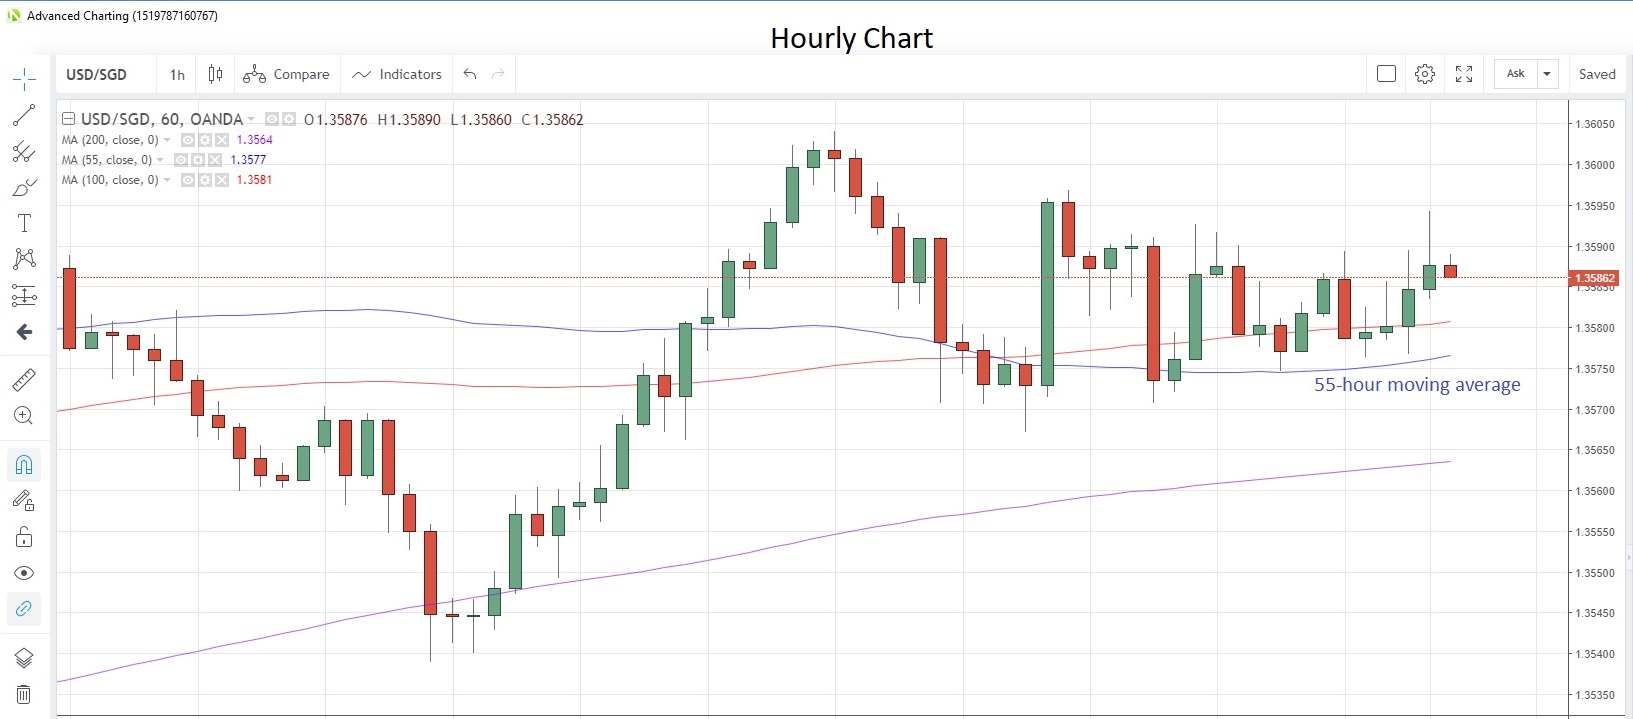
The Singapore dollar has edged marginally lower versus its US counterpart since the release, with the 55-hour moving average at 1.3576 providing technical support for now. USD/SGD is at 1.3585.
USD/SGD Hourly Chart
Source: OANDA fxTrade
China inflation benign
Consumer prices in China rose 1.7% y/y in January, the slowest increase since January last year, while producer prices showed an even more benign environment, rising just 0.1% y/y and showing a slower pace for the seventh month in a row. This prompted local financial press to start commenting on the risk of deflation, a notion that had been denounced last month by China’s National Bureau of Statistics, saying it was inappropriate.
Will U.K. retail sales be as bad as the U.S.?
Japan’s industrial production data for December is imminent, and expected to show a monthly contraction for a fourth straight month. U.K. retail sales data for January kick off the European session, with economists hoping it will not echo the weak data out of the U.S. yesterday. They expect sales to rise 0.2% from a month earlier. From Europe, we see the Euro-zone’s trade balance and hear a speech from ECB’s Coeure.
The U.S. session is mostly second-tier data with industrial production and capacity utilisation for January and the Michigan sentiment indicator for February on tap. Fed’s Bostic speaks for the second time this week.


