If in early January, you’d have described to us everything that was to happen with the world and global economy and then asked us to guess where the stock market would be, we would not have guessed it would be at today’s level.
Looking at the stock market today, the first thought that comes to mind is that it is divorced from economic reality. The S&P 500 is only a few percent away from where it started 2020.
On the surface it looks like stocks discount one incredibly rosy version of the future. In that version everything goes back to normal like nothing happened; we basically just entered and quickly exited a sharp recession and earnings came back to pre-coronavirus normal. Though that is a possible outcome, it is not a probable one, judging by what is happening right now. We’d like to note that, in any scenario, we’ll exit with close to $10 trillion of additional debt on the government’s and the Fed’s balance sheets
I used the word discount. To discount something you bring future earnings (cash flows) at a discount rate to today’s dollars. The Federal Reserve bought trillions of dollars of US Treasuries and corporate bonds of suspect quality through ETFs, taking interest rates to almost zero. This act has pushed the discount rate lower and wound up the spring of the music box in the Fed’s game of musical chairs. So the market behavior to a large degree reflects not the sum of future scenarios but the much lower discount rate by which these scenarios are discounted.
Since the Fed is buying, the music is playing, and investors keep dancing (speculating). Greed is back. It seems that this music just keeps on playing.
But will it?
The economy is a very complex organic system created by trillions of individual transactions. The Fed’s involvement introduces inorganic matter into the ecosystem that slowly poisons and atrophies the system. The Fed’s active involvement distorts price signaling (higher prices lead to higher demand and vice versa) as it manipulates the price of the most fundamental commodity in the system—interest rates (the price of money).
The Fed’s buying junk bonds through ETFs has brought us closer to a Walking Dead economy. It has given a further lease on life to mostly dead companies that otherwise would have perished. But it’s easy for me to sit here and criticize. If I ran the Fed in March 2020, I probably would have done the same thing—the possible cost of doing nothing would have been a global depression. The bottom line is that the Fed temporarily stimulated a humongous amount of greed in a system that was shaking in fear.
We are not investing in the economy we’d like to have, but in the one we have. However, this dance cannot go on forever or at some point the Fed will own all financial assets and the US economy will turn into a Potemkin village. This is why, though it has been unfashionable and even counterproductive lately, we’ll keep sticking to buying great, undervalued companies, not just great companies irrespective of price.
Nifty FANGAM
While you are pondering on this, here is another observation.
If you look deeper under the hood of the stock market, you’ll see that there is a significant dichotomy between bytes stocks and atoms stocks. The atoms are losing to the bytes, badly. If you compare performance of the S&P 500 (via SPDR S&P 500 ETF (NYSE:SPY)) traditional market-capitalization index—the one you see in the news—to its less-known cousin, the Invesco (NYSE:IVZ) S&P 500® Equal Weight ETF (NYSE:RSP), you’ll see a significant disparity in performance.
In the market cap-weighted version, the top five stocks (all five are members of FANGAM gang – Facebook (NASDAQ:FB), Amazon (NASDAQ:AMZN), Netflix (NASDAQ:NFLX), Google (NASDAQ:GOOGL), Apple (NASDAQ:AAPL), Microsoft (NASDAQ:MSFT)) now represent 21% of the capitalization of the index (the last time this happened was 1999) and thus account for 21% of the returns. In RSP these stocks have a weight of 0.1% (they’re just 5 out of 500 stocks).
SPY is down 6% for the year, whereas RSP is down 16%—remember, same stocks, it’s just that SPY is heavily weighted toward bytes stocks, as they have larger market caps, and RSP treats bytes and atoms equally. The virus has been much kinder to bytes than atoms stocks; it has benefitted those companies as our world has become a bit more virtual and atoms were impacted by social distancing. The problem is, bytes were very expensive going into the coronavirus crisis, and they just got even more pricey (unless their businesses have improved to a greater degree than their stocks prices appreciated, which is possible but unlikely, with the possible exception of Amazon).
Just as any propaganda needs a certain germ of truth to grow from, so do bubbles. The FANGAM are incredible companies (germ of truth), and they function better in the virus-infested world (another germ of truth). But at the core, their existence is grounded in the world that is built of atoms, not bytes.
For instance, Google’s advertising business will continue to take market share from non-digital forms of advertisement (not sure if any are left), but atom-based companies are the largest source of Google’s advertising revenue. If the atom world is not doing well, neither will Google. Also, the law of large numbers usually kicks in at some point: a company cannot grow at supernormal rates forever or it will become bigger than the market it is serving.
The Nifty Fifty stocks come to mind here. Those were the fifty stocks—the who’s who of the 1960s—that made America great (then): Coca Cola (NYSE:KO), Disney (NYSE:DIS), IBM (NYSE:IBM), Philip Morris (NYSE:PM), McDonald’s (NYSE:MCD)), Procter & Gamble (NYSE:PG) … the list goes on. Though today we look at some of them as has-beens, in the ’60s and ’70s the world was their oyster. Coke and McDonald's were spring chickens then, spreading the American health values of diabetes and cholesterol (okay, maybe I’m being too hard on them) across this awesome planet.
Although it was hard to imagine in the ’70s that any of these companies would not shine forever, they are a useful reminder that even great companies get disrupted. Avon, Kodak (NYSE:KODK), Polaroid, General Electric (NYSE:GE), Xerox (NYSE:XRX)—all were Nifty Fifties, and all either went bankrupt or are heading towards irrelevancy.
In the 1960s and early 1970s these stocks were one-rule stocks...and the rule was, buy! They were bought, and bought, and bought. They were great companies and paying attention to how much you paid for them was irrelevant.
Until.
The Nifty FANGAM is arguably not as expensive as the Nifty Fifty was in 1972. Lawrence Hamtil put this nice table together, using data gathered by The Brooklyn Investor blog, which divides the Nifty Fifty stocks into two groups. The cheap basket traded at around 28 times earnings and the expensive basket at about 60 or so. Neither the cheap nor the expensive basket did well in the decade of the ’70s. Today, FANGAM stocks in general trade closer to the cheap basket’s valuation.
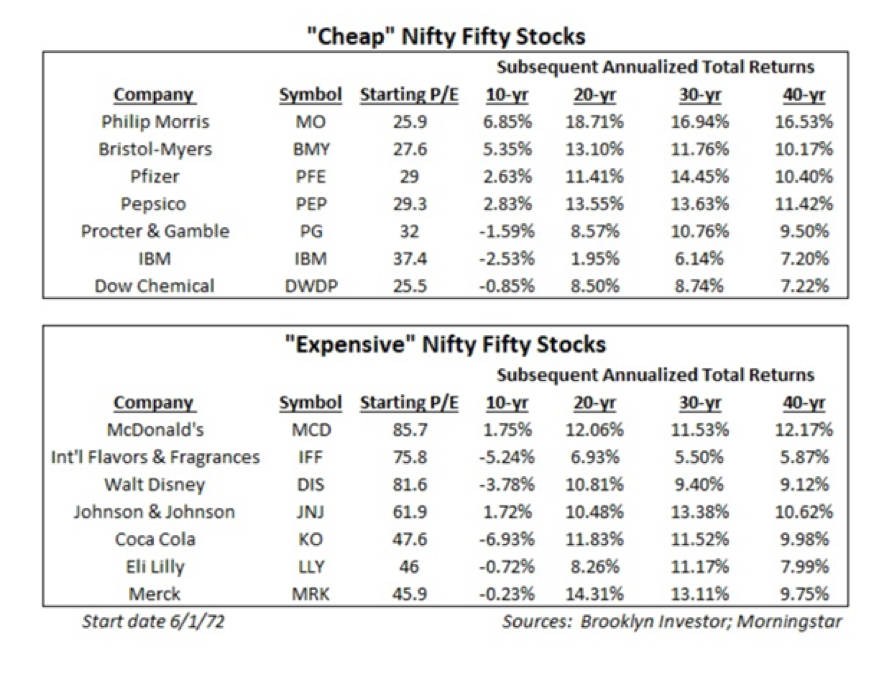
If you bought and held Coke or McDonald's in 1972 (or any other Nifty Fifty stock), then you experienced a painful decade of no returns; in fact, at times you were down 50% or more. Coca Cola was as great a company in 1974 as it was in 1972, but the stock was down 50% from its high. Okay, Coca Cola was trading at 47 times earnings in 1972. But even a company like Procter & Gamble that was trading at “only” 32 times earnings in 1972 was down almost 50% in 1974 from its 1972 high. It took until the early 80s—a decade—until investors who bought Nifty Fifties at the top broke even—and this applies to almost all of them.
Nifty Fifty (1970’s)
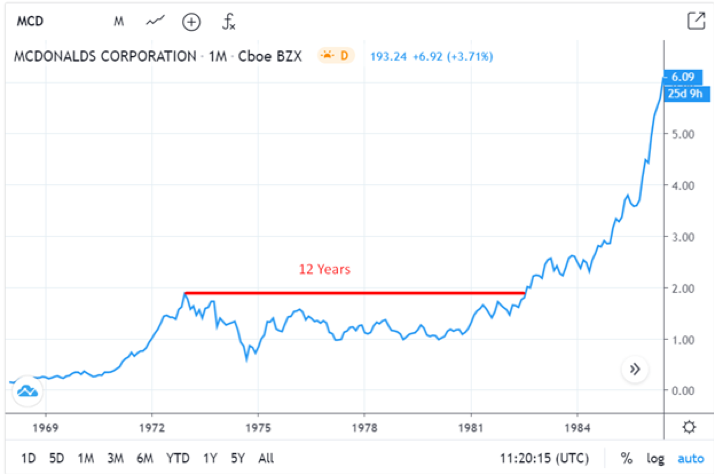
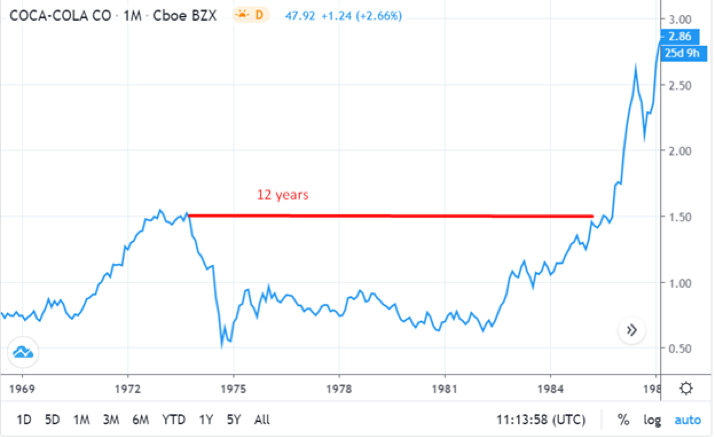
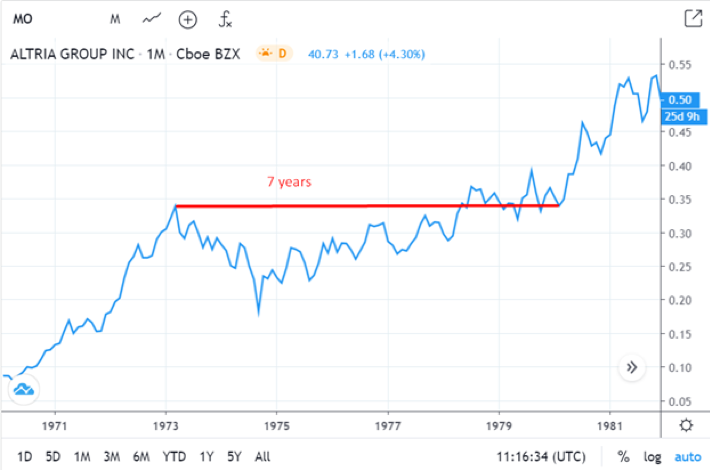
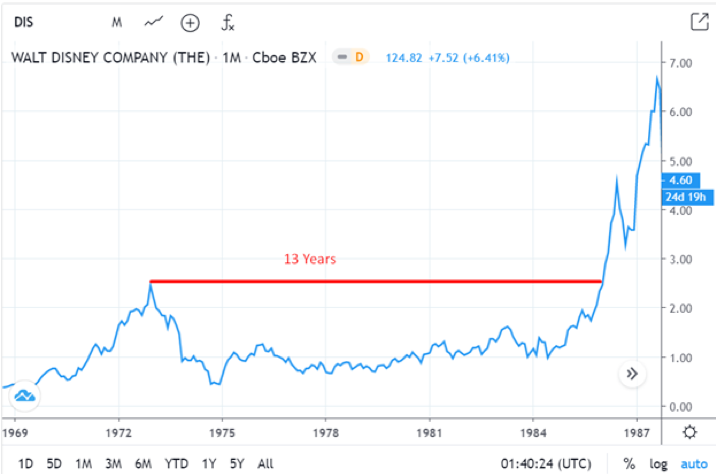
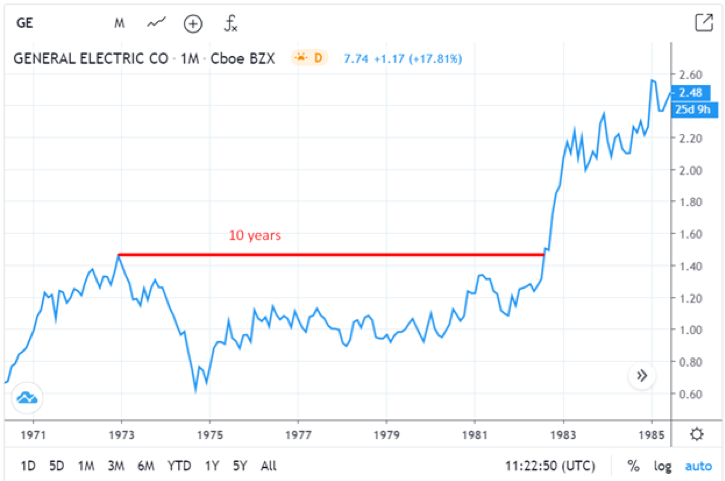
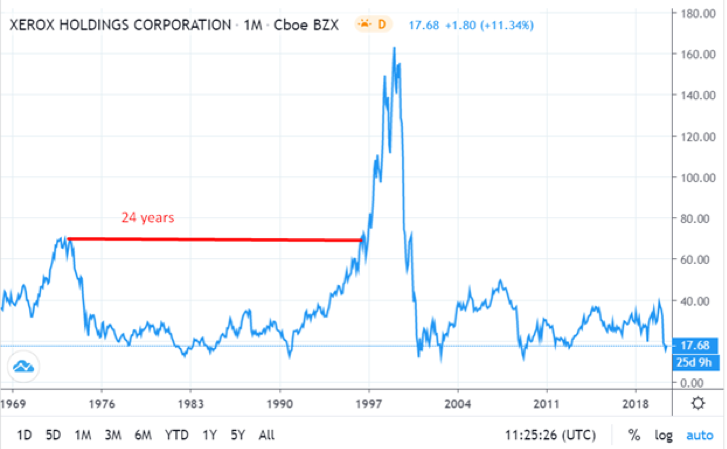
In today’s far less patient world, that decade might as well be infinity.
As I am writing this I am struggling with a few issues. First, interest rates and inflation were much higher in the ’70s and early ’80s. Now, interest rates are at zero, going to negative or to … no idea what level. Globalization was deflationary, thus de-globalization will likely be inflationary; but automation may dampen the inflationary impact, at least some of it. If we get negative rates, then on one hand they should boost stocks’ price-to-earnings ratio. (Paradoxically, the further a company’s cash flow is in the future, the more it is worth in today’s dollars. Yes, makes little sense to us, either). On the other hand, if we have negative rates, that means we are desperate and thus earnings are collapsing.
In an inflationary environment, most earnings growth will be eaten away by declining price-to-earnings, as it happened in the ’70s.
Another issue: If you held many Nifty Fifties for 20 years, from 1972 to 1992, they would have delivered a decent (10%-plus) return. This sounds great in theory; however, most people would have run out of patience after a decade of no or negative returns and thus not have been around for the fruits of the ’80s decade. In other words, shareholders who bought the stocks in 1970 were not the ones who benefitted from the returns in the late ’80s.
Today the Nifty FANGAM has turned into one-rule stocks—buy! (irrespective of price). If you did not own them over the last decade, your portfolio had an enormous headwind against it.
But what the Nifty Fifties showed us is that company greatness and past growth are not enough. Starting valuation—what you actually pay for the business—matters. The great companies will still be great when their stocks are down a bunch and they have a decade of no returns. Dividends aside, stock returns in the long run are not just driven by earnings growth but by what the price-to-earnings does as well. If price-to-earnings is high, it’s mean reverts—declines—chipping away at the return you receive from earnings growth. I (this is Vitaliy) wrote two books on this topic.
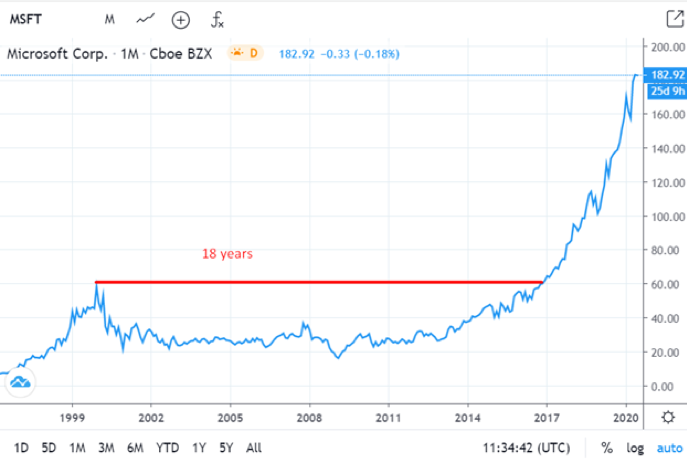
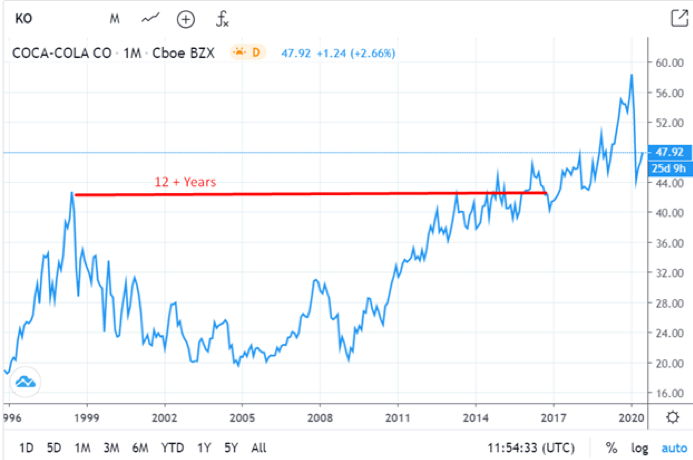
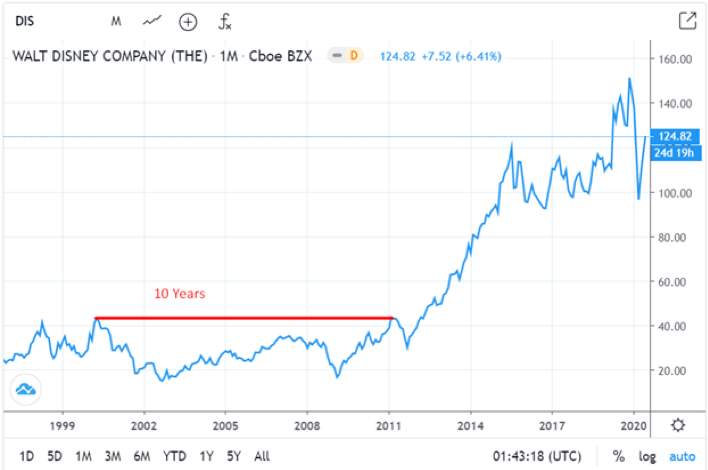
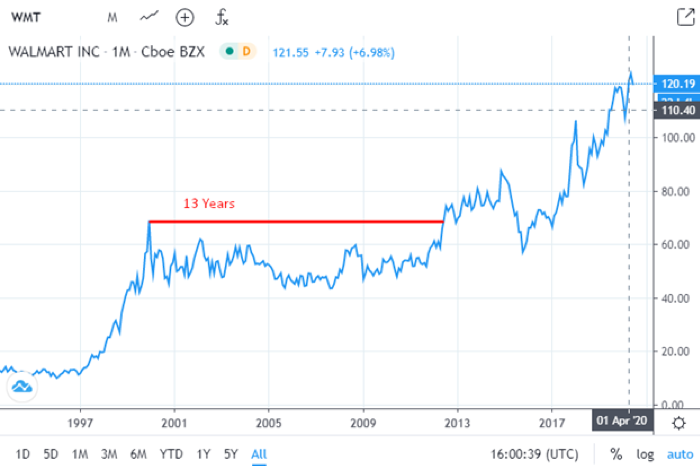
The ’70s were almost fifty years ago. Fine, just look up Microsoft, Cisco Systems (NASDAQ:CSCO), Coca Cola, and Wal-Mart (NYSE:WMT) stock charts from the late ’90s, and you’ll see that history repeats itself, again and again (see charts below).
What you pay for even a great company matters. Paraphrasing the great Freddie Mercury, there must be more to the stock market than FANGAM (though that has not been the case lately). They were the tailwind for the S&P 500, but they’ll likely turn into a headwind over the next decade, and become an anchor around its neck.
Nifty Nineties (1990’s)
And one more thing…
I am not a journalist or reporter; I am an investor who thinks through writing. This and other investment articles are just my thinking at the point they were written. However, investment research is not static, it is fluid. New information comes our way and we continue to do research, which may lead us to tweak and modify assumptions and thus to change our minds.
We are long-term investors and often hold stocks for years, but as luck may or may not have it, by the time you read this article we may have already sold the stock. I may or may not write about this company ever again. Think of this and other articles as learning and thinking frameworks. But they are not investment recommendations. The bottom line is this. If this article piques your interest in the company I’ve mentioned, great. This should be the beginning, not the end, of your research.
Read this before you buy your next stock
Disclosure: Vitaliy Katsenelson is CIO at Investment Management Associates; His investment strategy is spelled out here.
