Get 40% Off
⚠ Earnings Alert! Which stocks are poised to surge?
See the stocks on our ProPicks radar. These strategies gained 19.7% year-to-date.
Unlock full list

Nifty 50 Bulls Unable To Stop The Bleeding

Published 09/25/2018, 05:56 AM
Updated 07/09/2023, 06:31 AM

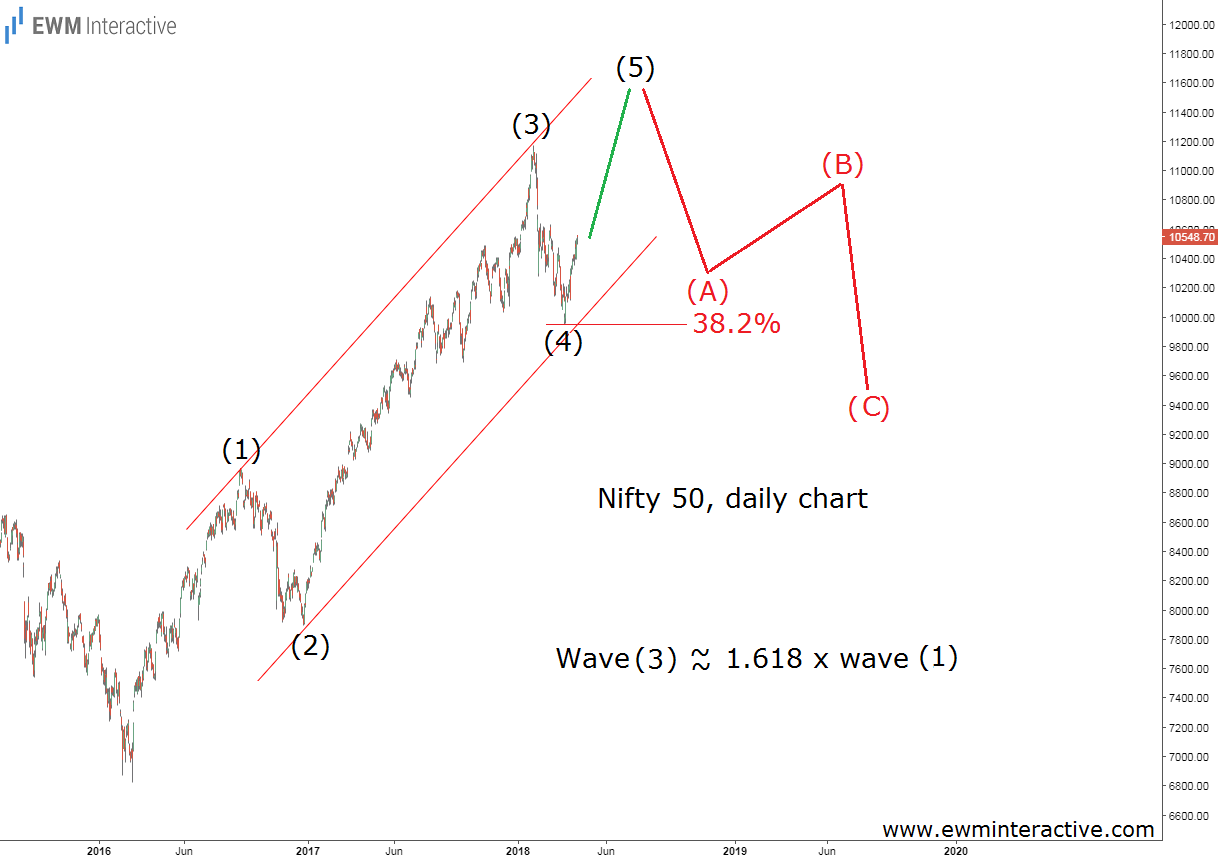
We published our last update on the Indian Nifty 50 almost four months ago, on June 6th, when the benchmark index was hovering around 10 550. Despite the recent selloff from 11 172 to 9 952, the Elliott Wave outlook was still positive. With the help of the chart below, we concluded the index is still headed north and “the bulls should eventually be able to reach a new all-time high between 11 200 and 12 000.
Nifty 50 Daily

Our optimism derived from the fact that trends develop in repetitive patterns, called waves. Since Nifty 50 was still in an uptrend, a five-wave pattern known as an “impulse” was supposed to emerge from the bottom at 6826 in February 2016. As visible, wave (4) had bounced up exactly from the 38.2% Fibonacci level and wave(5) was still missing. A new all-time high had to occur, in order to complete the pattern.

On the other hand, the theory states that every impulse is followed by a three-wave pullback in the opposite direction. So instead of joining the bulls when wave (5) exceeded the top of wave (3), traders would be better off staying aside in anticipation of a bearish reversal.

Nifty 50 Elliott Wave Update

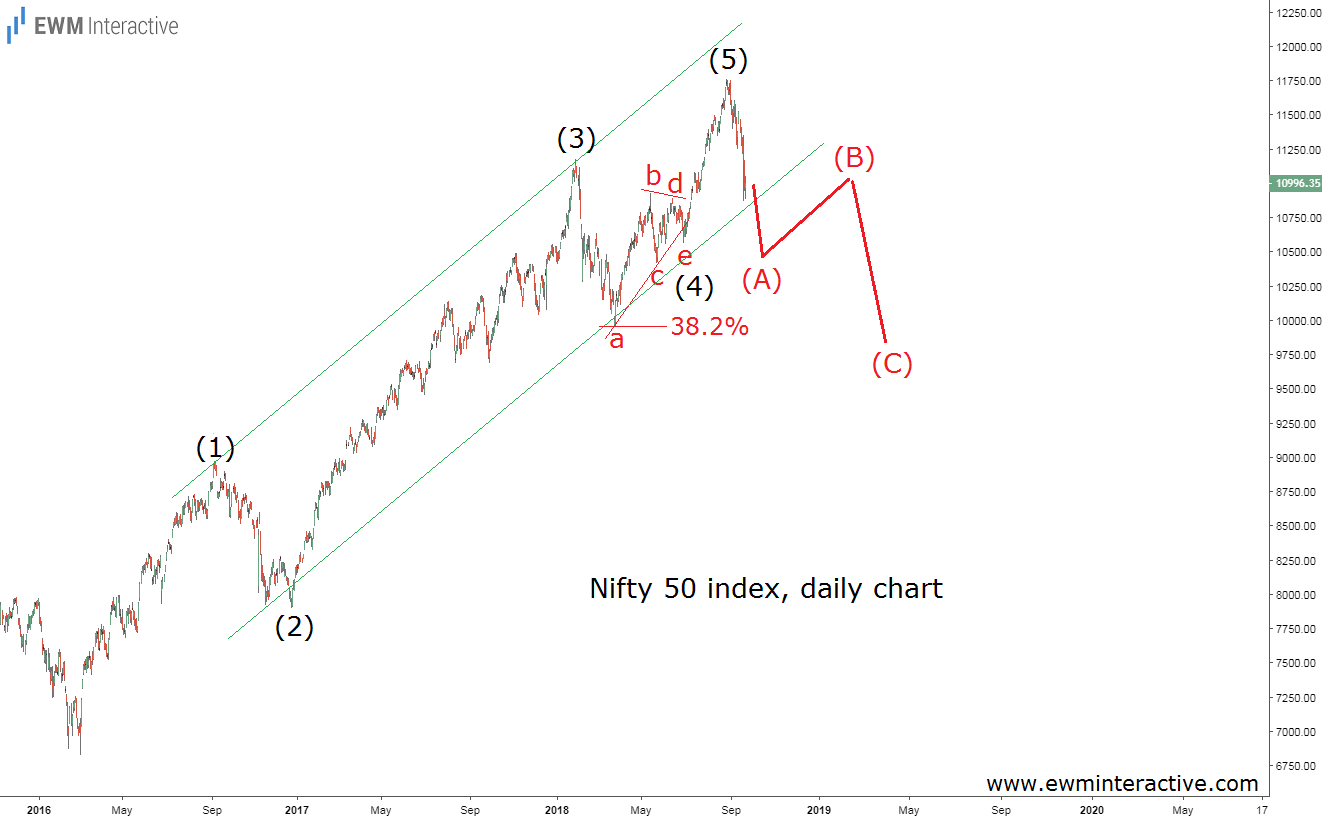
Nifty 50 climbed to a new record high of 11 760 on August 28th. Less than a month later, on September 21st, it fell to an intraday low of 10 866. The bearish reversal the Wave principle warned us about nearly four months ago is one month in the past now. The updated chart below visualizes how things have been going.
Nifty 50 Daily

Actually, wave (4) was not over at 9 952. Instead, it developed as an a-b-c-d-e triangle correction, without changing the overall outlook in any material way.

As of this writing, Nifty 50 is trading slightly above the 11 000 mark. The price is now knocking on the support line drawn through the lows of waves (2) and (4), and if this count is correct, it has a good chance of breaching it. We believe the bears should at least be able to drag the index down to the termination level of wave “a” of (4). In terms of price, this means a decline to under 10 000 is on the cards. It looks like it is too early to buy the dip as the Nifty 50 is poised to lose another 1000 points from current levels.

Original post

Latest comments

Market is currently at nearby it's previous low that is nearby 9900. if market breach it's previous low it means market has break it's higher high and higher low formation, which is there in the market as of now. Market is unstable till election. Unstable means sideways or downtrend, people will react more often on negative side because lack of patience. so chances are market will break it's formation of higher high and higher low. If break and market holds then market should go till 9200. next week is crucial to see the next continue or reversal.
It means that Nifty Tomorrows opening will be gap down, Support will be at 10400; If it beaches then at 10320, Am I right..!! Or Tomorrow we can see Nifty opening at Higher Level..!!
Risk Disclosure: Trading in financial instruments and/or cryptocurrencies involves high risks including the risk of losing some, or all, of your investment amount, and may not be suitable for all investors. Prices of cryptocurrencies are extremely volatile and may be affected by external factors such as financial, regulatory or political events. Trading on margin increases the financial risks.
Before deciding to trade in financial instrument or cryptocurrencies you should be fully informed of the risks and costs associated with trading the financial markets, carefully consider your investment objectives, level of experience, and risk appetite, and seek professional advice where needed.
Fusion Media would like to remind you that the data contained in this website is not necessarily real-time nor accurate. The data and prices on the website are not necessarily provided by any market or exchange, but may be provided by market makers, and so prices may not be accurate and may differ from the actual price at any given market, meaning prices are indicative and not appropriate for trading purposes. Fusion Media and any provider of the data contained in this website will not accept liability for any loss or damage as a result of your trading, or your reliance on the information contained within this website.
It is prohibited to use, store, reproduce, display, modify, transmit or distribute the data contained in this website without the explicit prior written permission of Fusion Media and/or the data provider. All intellectual property rights are reserved by the providers and/or the exchange providing the data contained in this website.
Fusion Media may be compensated by the advertisers that appear on the website, based on your interaction with the advertisements or advertisers.
© 2007-2024 - Fusion Media Limited. All Rights Reserved.