
Nielsen Holdings plc (NYSE:NLSN) reported third-quarter 2019 adjusted net earnings of 51 cents per share, beating the Zacks Consensus Estimate of 42 cents. Also, the figure was up 13.3% from the year-ago quarter.
The increase in earnings was driven by higher operating profit and a lower effective tax rate.
Total revenues came in at $1.616 billion, increasing 1% year over year. Also, the reported revenues increased 2.4% on a constant-currency basis. The top line marginally surpassed the Zacks Consensus Estimate of $1.60 billion.
As part of the ongoing strategic review plan, the company has decided to separate Global Media and Global Connect businesses into two independent, publicly-traded companies - the Global Media business and the Global Connect business.
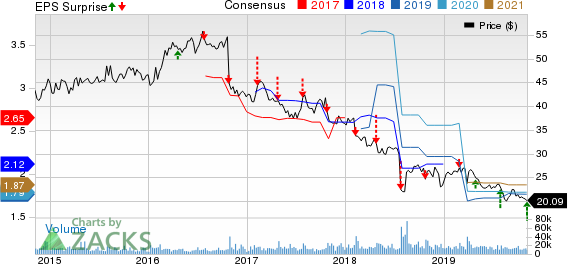
Nielsen Holdings Plc Price, Consensus and EPS Surprise
Top-Line Details
Global Media revenues during the third quarter were $870 million (accounting for 54% of its total revenues), reflecting an increase of 3.9% from the year-ago level or 4.6% on a constant-currency basis. Audience Measurement revenues also increased 4.2% from the prior-year quarter, driven by continued client adoption of its Total Audience Measurement system, partly offset by pressure in local television measurement.
However, Plan/Optimize revenues decreased 3.3% year over year or 4.2% on a constant-currency basis, driven by growth at Gracenote, partially offset by pressure in Telecom.
Global Connect revenues during the quarter were $746million (46% of total revenues), reflecting a 2.2% decrease from the year-ago period.The figure was flat on a constant-currency basis.
Revenues in Measure decreased 2.8% year over year. Excluding foreign currency impact, revenues decreased 0.4% from the prior-year quarter, reflecting declines in developed markets, partially offset by strong retail measurement services and improved trends in emerging markets.Also, Predict/Activate revenues decreased 0.9% from the year-ago quarter but increased 0.9% on a constant-currency basis.
Operating Results
Gross margin was 57.1%, down 30 basis points (bps) from the year-ago period.
Nielsen’s operating expenses — namely selling, general and administrative — were $467 million, increasing 0.6% from the year-ago figure.
Adjusted EBITDA was $476 million in the third quarter, increasing 1.1% from the prior-year level. Also, adjusted EBITDA margin expanded 2 bps to 29.5%, as productivity initiatives were offset by investments in growth initiatives.
Balance Sheet & Cash Flow
Nielsen exited the quarter with a cash balance of approximately $389 million compared with $393 million in the second quarter.
Gross debt in the third quarter was $8.49 billion. Net debt (gross debt excluding cash and cash equivalents) was $8.1 billion, and net debt leverage ratio was 4.38 at the end of the quarter.
Cash flow from operations was $413 million, capex totaled $112 million and free cash flow amounted to $301 million in the third quarter.
Guidance
Management reiterated its full-year 2019 guidance for revenues,adjusted EBITDA and free cash flow but upwardly revised itsview for adjusted earnings per share.
The company expects total revenues to be approximately $6.4 billion on a constant-currency basis, adjusted EBITDA margin of 28-29% and adjusted EBITDA within $1,800-$1,900 million. Nielsen expects free cash flow in the range of $525-$575 million.
It now expects adjusted earnings per share in the range of $1.77-$1.83 versus $1.70-1.80 projected earlier.
Zacks Rank and Stocks to Consider
Nielsen currently carries a Zacks Rank #3 (Hold). Some better-ranked stocks in the broader technology sector include Stamps.com Inc. (NASDAQ:STMP) , AMETEK, Inc. (NYSE:AME) and Carvana Co. (NYSE:CVNA) . While Stamps.com sports a Zacks Rank #1 (Strong Buy), AMETEK and Carvana carry a Zacks Rank #2 (Buy). You can see the complete list of today’s Zacks #1 Rank (Strong Buy) stocks here.
Long-term earnings growth for Stamps.com, AMETEKand Carvana is currently projected at 15%, 10.91% and 9%, respectively.
Wall Street’s Next Amazon (NASDAQ:AMZN)
Zacks EVP Kevin Matras believes this familiar stock has only just begun its climb to become one of the greatest investments of all time. It’s a once-in-a-generation opportunity to invest in pure genius.
Nielsen Holdings Plc (NLSN): Free Stock Analysis Report
Stamps.com Inc. (STMP): Free Stock Analysis Report
AMETEK, Inc. (AME): Free Stock Analysis Report
Carvana Co. (CVNA): Free Stock Analysis Report
Original post
Zacks Investment Research