Get 40% Off
⚠ Earnings Alert! Which stocks are poised to surge?
See the stocks on our ProPicks radar. These strategies gained 19.7% year-to-date.
Unlock full list

Natural Gas: Steep Fall

Published 01/01/2019, 09:18 AM
Updated 07/09/2023, 06:31 AM

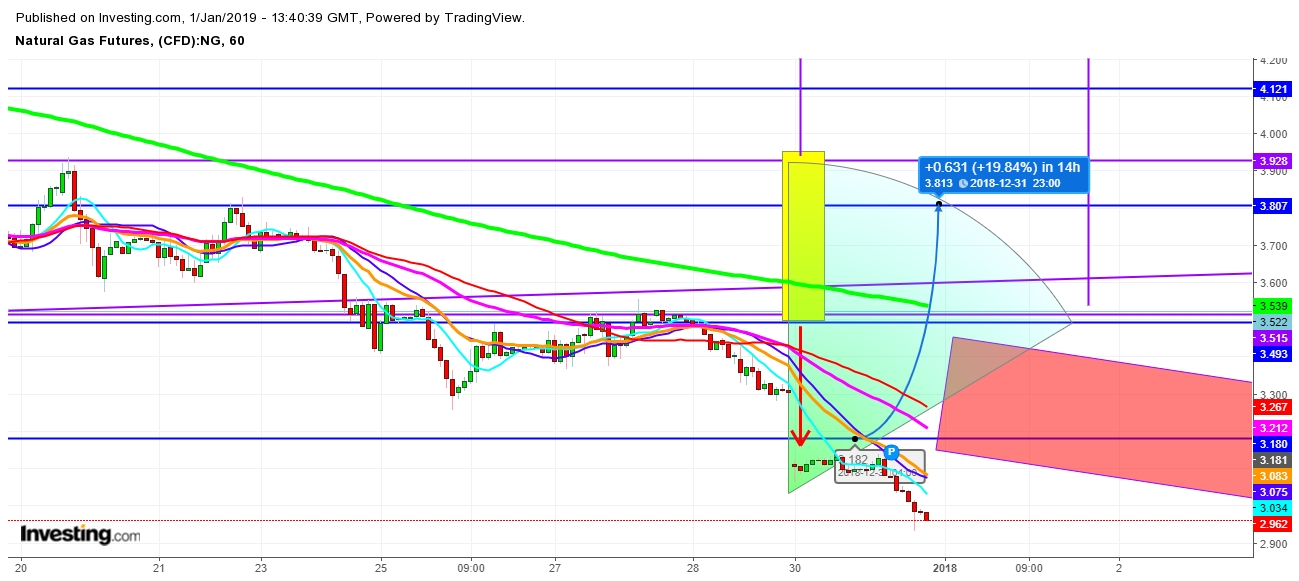
In my last analysis, I mentioned the possibility that Natural Gas futures would make a steep move in either direction. Natural Gas futures preferred to be on the steep downward move after breaking the marked zone on the lower side. An extraordinary downward move has now pushed the Natural Gas futures into oversold territory. Let’s have a look at the movements of Natural Gas futures in the same chart on December 31st, 2018 at 16:00:00:

Natural Gas Futures 1 Hr. Chart - Decisive Zones

No doubt that the extraordinary bearishness overwhelmed the Natural Gas trading scenario, but the smart investors, who keep themselves aside from mass behavior look not to miss such an extraordinary opportunity to go long. They know the fluctuating behavior of the Natural Gas, which always remains the most liquid commodity of the World based on the emotional or psychological behavior of the masses more than anything else. This is the main reason that most of the analysts feel too reluctant to express their views about the possible directional moves of Natural Gas futures. Most analysts prefer only to talk about fundamentals and weather outlooks in order to avoid unnecessary criticism from amateur critics.

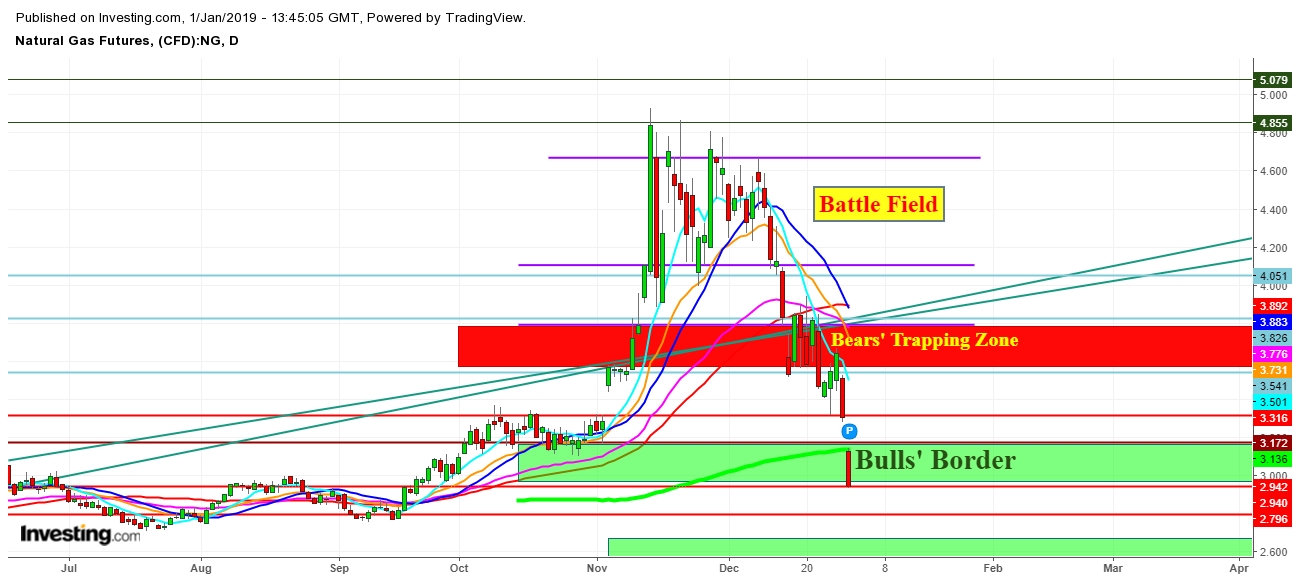
On analysis of the movements of Natural Gas futures in the same chart pattern “Territorial Zones,” I find that the Natural Gas futures are well inside the “Bulls Border,” which makes it possible that Natural Gas will move steeply upward from current levels soon. Let’s have look at the movements of Natural Gas futures in the same chart on the last trading session of 2018.

Natural Gas futures Daily Chart - Expected Territorial Zones

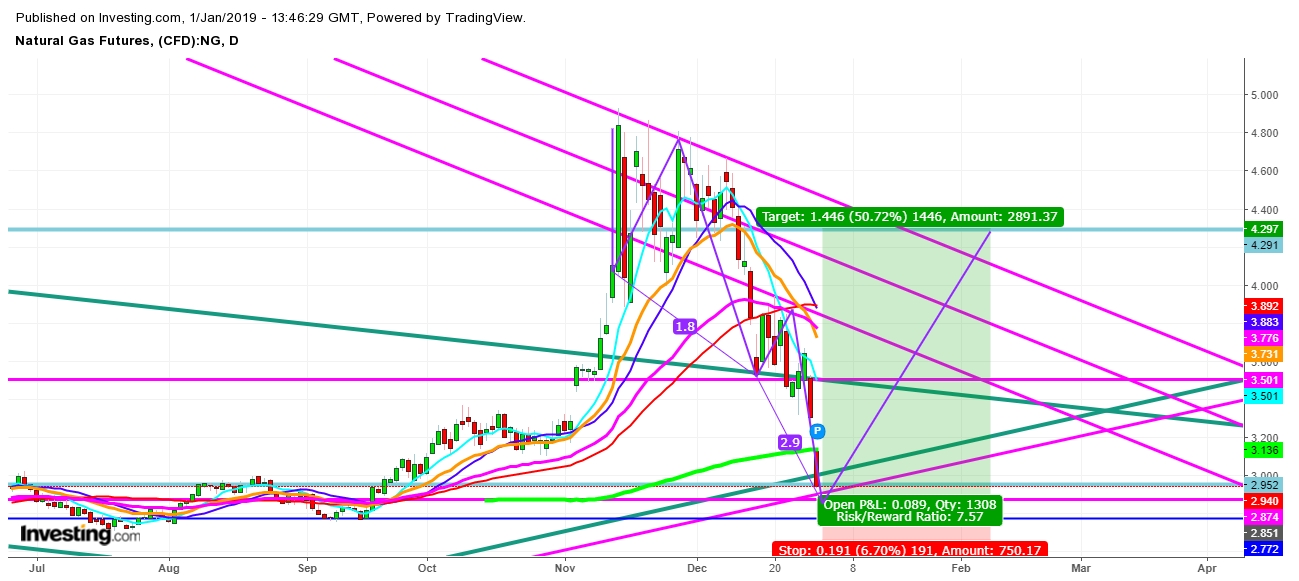
I find this downward move to push the natural gas futures price at the monthly support levels; which will provide a strong upward push to natural gas futures back up to the levels above $3.388 once again during the month of January 2019. I find the following trading zones for Natural Gas futures, with expected directional moves, during the January 1st – February 8th, 2019. Let’s have a look at the movements of Natural Gas futures in the following chart.

Natural Gas futures Daily Chart - Expected Trading Zones From January 1st - February 8th, 2019


Disclaimer

1. This content is for information and educational purposes only and should not be considered as an investment advice or an investment recommendation. Past performance is not an indication of future results. All trading carries risk. Only risk capital be involved which you are prepared to lose.

2. Remember, YOU push the buy button and the sell button. Investors are always reminded that before making any investment, you should do your own proper due diligence on any name directly or indirectly mentioned in this article. Investors should also consider seeking advice from an investment and/or tax professional before making any investment decisions. Any material in this article should be considered general information, and not relied on as a formal investment recommendation.

Latest comments

Natty is very hard to follow... Thanks a lot for all your analysis. Most of the time you are right. Those who read you and are upset should learn how to read English ...
Trade against his views, you will readily win.
Satendra Singh is on the money most of the time I look forward to his analysis always. However, I wish he can elaborate a little more on his Chart analysis
Mr Singh is correct when the market is bullish as he somehow seems to favour bullish bets most of the time! While i agree that there are causes for being a bull at $3 levels during winter a bullish stand when the prices ranged 4.7s is a bit of a stretch for even the most optimist
Risk Disclosure: Trading in financial instruments and/or cryptocurrencies involves high risks including the risk of losing some, or all, of your investment amount, and may not be suitable for all investors. Prices of cryptocurrencies are extremely volatile and may be affected by external factors such as financial, regulatory or political events. Trading on margin increases the financial risks.
Before deciding to trade in financial instrument or cryptocurrencies you should be fully informed of the risks and costs associated with trading the financial markets, carefully consider your investment objectives, level of experience, and risk appetite, and seek professional advice where needed.
Fusion Media would like to remind you that the data contained in this website is not necessarily real-time nor accurate. The data and prices on the website are not necessarily provided by any market or exchange, but may be provided by market makers, and so prices may not be accurate and may differ from the actual price at any given market, meaning prices are indicative and not appropriate for trading purposes. Fusion Media and any provider of the data contained in this website will not accept liability for any loss or damage as a result of your trading, or your reliance on the information contained within this website.
It is prohibited to use, store, reproduce, display, modify, transmit or distribute the data contained in this website without the explicit prior written permission of Fusion Media and/or the data provider. All intellectual property rights are reserved by the providers and/or the exchange providing the data contained in this website.
Fusion Media may be compensated by the advertisers that appear on the website, based on your interaction with the advertisements or advertisers.
© 2007-2024 - Fusion Media Limited. All Rights Reserved.