
Newell Brands Inc. (NASDAQ:NWL) has delivered better-than-expected earnings and sales numbers in third-quarter 2019. However, both metrics moved down year over year on lost contributions from divested businesses, adverse foreign currency translations and a decline in overall core sales.
Nevertheless, management remains optimistic on progress of its turnaround efforts along with operating cash flow remaining ahead of its plan. This is backed by the company’s commitment toward productivity, cost savings and working capital efforts. As a result, it raised sales and earnings per share view for 2019.
Q3 Highlights
Newell’s third-quarter normalized earnings per share were 73 cents, which outpaced the Zacks Consensus Estimate of 56 cents. However, the metric fell 5.2% from 77 cents earned in the year-ago period. The year-over-year decline was mainly attributed to the lack of contributions from its divested operations.
Newell Brands Inc. Price, Consensus and EPS Surprise
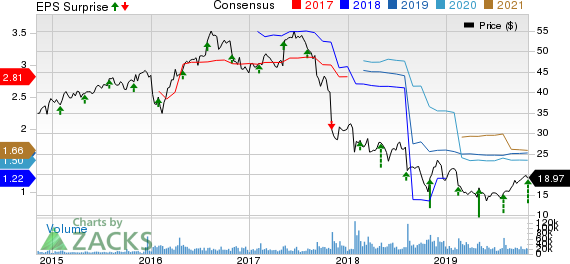
Newell Brands Inc. price-consensus-eps-surprise-chart | Newell Brands Inc. Quote
Net sales declined 3.8% to $2,450.6 million from the year-earlier figure but surpassed the Zacks Consensus Estimate of $2,439 million. The year-over-year fall resulted from foreign currency headwinds and soft core sales, which dipped 2.5%. However, core sales grew at four of the company’s seven operating divisions.
Normalized gross margin declined 40 basis points (bps) to 35.1%. Also, normalized operating margin contracted 50 bps to 12.7% in the quarter under review, driven by increased advertising costs.
Segmental Performance
With respect to Newell’s decision to retain its Rubbermaid Commercial Products business, management realigned the segmental reporting structure, effective the third quarter. As a result, the company now operates and reports under four segments, namely Home & Outdoor Living; Learning & Development; Appliances & Cookware; and Food & Commercial. Earlier, it reported under Home & Outdoor Living; Learning & Development; and Food & Appliances segments.
In third-quarter 2019, the Learning & Development segment (including Writing and Baby) recorded net sales of $824 million, which slipped 0.6% from the prior-year number. Further, the segment’s core sales inched up 0.5%, which was offset by unfavorable foreign currency. Core sales growth was backed by improvement at the Baby and Writing divisions.
Net sales at the Home & Outdoor Living segment (including Outdoor & Recreation, Home Fragrance, and Connected Home & Security) totaled $723 million, declining 0.6% from the prior-year period. The segment’s top line was hurt by unfavorable currency and the exit of about 72 underperforming Yankee Candle retail outlets in the first nine months of 2019, which were somewhat offset by core sales growth of 1.3%.
The Appliances & Cookware segment recorded net sales of $430 million, which fell 5.3% from the prior-year number. This resulted from core sales decline of 3.7% and currency headwind.
Meanwhile, net sales at the Food & Commercial segment were $473 million, which dipped 12.2% on adverse currency and core sales decline of 11.3%.
Other Developments
Newell decided to retain the Mapa/Spontex and Quickie businesses, which will be included in the financial results of continuing operations in the fourth quarter. These businesses, which were earlier classified as held-for-sale and discontinued operations, are anticipated to be accretive to sales, operating margin, earnings per share, and operating cash flow in 2020 and beyond.
Further, the U.S. Playing Cards business, which is held as discontinued operations, is presently under contract for sale and is likely to close by 2019 end.
Management now estimates to achieve net-debt-to-EBITDA leverage ratio of about 4 by 2019 end, and roughly 3.5 by 2020 end.
Other Financial Details
Newell ended the quarter with cash and cash equivalents of $465.4 million, long-term debt of $5,691.7 million, and shareholders’ equity of $4,137.6 million, excluding non-controlling interests of $30.9 million.
During the first nine months of 2019, the company generated operating cash flow of $424.1 million compared with $181.6 million in the comparable quarter last year.
Furthermore, it strengthened its balance sheet with the completion of a $700-million debt tender offer. Moreover, the company declared plans to redeem $300 million of 5% Senior Notes due 2023, driven by robust operating cash flow.
Outlook
Management issued guidance for the fourth quarter while updated view for 2019. Net sales, core sales and normalized operating margin outlook for the fourth quarter and 2019 reflect the inclusion of Mapa/Spontex and Quickie businesses being part of continuing operations, effective the fourth quarter.
For 2019, the company projects net sales of $9.6-$9.7 billion and core sales decline in low-single digits. Earlier, net sales were anticipated to be $9.1-$9.3 billion. Normalized operating margin is now projected to be 10.6-10.8% compared with 10.4-10.8% mentioned earlier.
Further, operating cash flow is now projected to be $700-$850 million versus $600-$800 million mentioned earlier. Normalized earnings per share are now envisioned to be $1.63-$1.68 for the year, up from $1.50-$1.65 stated previously.
For fourth-quarter 2019, Newell estimates net sales of $2.5-$2.6 billion and core sales decline of 2-4%. It also anticipates normalized operating margin contraction of 10-50 bps to 11-11.4%. Normalized earnings per share are expected to be 35-40 cents for the quarter.
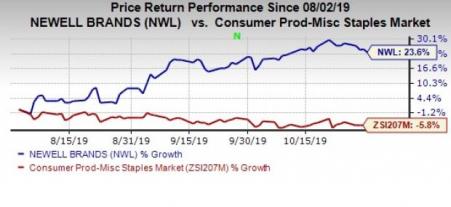
Price Performance
Shares of the Zacks Rank #3 (Hold) company have gained 23.6% in the past three months against the industry’s 5.8% decline.
Some Better-Ranked Consumer Staples Stocks
US Foods Holding Corp (NYSE:USFD) has an expected long-term earnings growth rate of 9.3%. It currently sports a Zacks Rank #1 (Strong Buy). You can see the complete list of today’s Zacks #1 Rank stocks here.
S&W Seed Company (NASDAQ:SANW) delivered average positive earnings surprise of 15.5% in the last four quarters. It presently carries a Zacks Rank #2 (Buy).
McCormick & Company, Incorporated (NYSE:MKC) has an expected long-term earnings growth rate of 8%. It currently carries a Zacks Rank #2.
7 Best Stocks for the Next 30 Days
Just released: Experts distill 7 elite stocks from the current list of 220 Zacks Rank #1 Strong Buys. They deem these tickers “Most Likely for Early Price Pops.”
Since 1988, the full list has beaten the market more than 2X over with an average gain of +24.5% per year. So be sure to give these hand-picked 7 your immediate attention.
See them now >>
Newell Brands Inc. (NWL): Free Stock Analysis Report
S&W Seed Company (SANW): Free Stock Analysis Report
McCormick & Company, Incorporated (MKC): Free Stock Analysis Report
US Foods Holding Corp. (USFD): Free Stock Analysis Report
Original post
Zacks Investment Research