The quarterly inflation data from New Zealand saw consumer prices rising 0.5% in the quarter ending September. It was higher than the median estimates of 0.4% and also beat the 0.2% forecast given by the Reserve Bank of New Zealand. The third quarter increase in inflation puts it in line with the RBNZ's target although the central bank is likely to wait for more evidence that inflation was firming.
Elsewhere, the German wholesale price index data showed a 0.6% increase on the month, beating estimates of 0.4% and doubling from the 0.3% increase in the previous month. The US dollar was seen maintaining its gains on Monday.
Looking ahead, the UK's consumer price index data is due for release today. Economists expect consumer prices in the UK to hit 3% in September, accelerating slightly from the 2.9% increase the month before. The BoE Governor Carney is expected to speak later in the day. From the Eurozone, the final inflation figures for September will be released today. Headline CPI is expected to rise 1.5% while core CPI is expected to rise 1.1% on a yearly basis.
EUR/USD Intraday Analysis

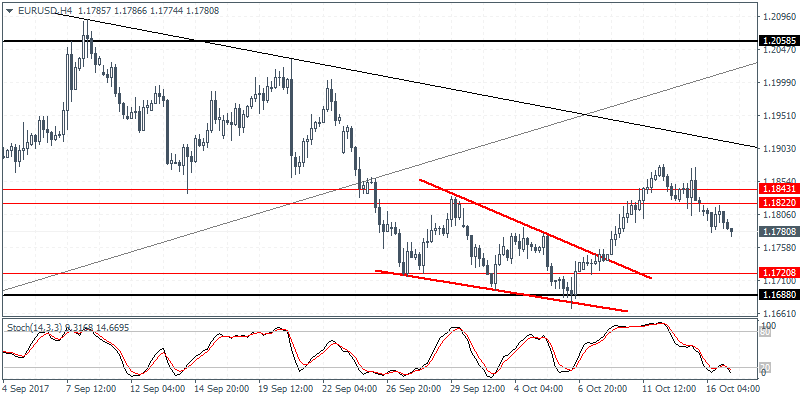
EUR/USD (1.1780):The EUR/USD was seen trading lower on Monday although price action was modest. Following the breakdown below the resistance and support level of 1.1843 - 1.1822, EUR/USD could be seen pushing lower. The next support at 1.1720 will be the next big target for the common currency. Overall, price action is likely to remain range bound, but the bias for a downside decline is increasing. On the daily chart, the EUR/USD is attempting to carve out a head and shoulders pattern with the neckline support seen at 1.1704. A breakdown below this level will see EUR/USD posting further declines for a minimum target of 1.1440.
USD/JPY Intraday Analysis

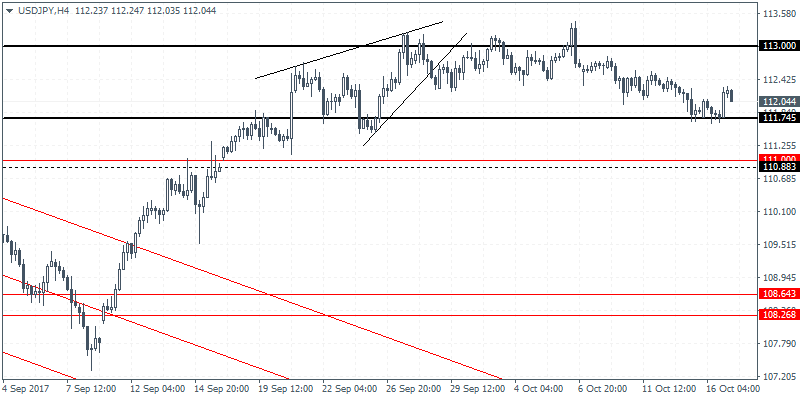
USD/JPY (112.04):The USD/JPY closed on a bullish note yesterday recovering from Friday's declines. Price action remains in a consolidation mode. On the 4-hour chart, the bounce off the minor support at 111.74 saw prices briefly pushing higher, although current price action is seen giving up some of the gains. With the range strongly established at 113.00 and 111.74, USD/JPY could be looking at a volatile breakout soon. While the gains to the downside are limited towards the next support at 111.00, to the upside, clearing the resistance at 113.00 could signal further gains in price.
XAU/USD Intraday Analysis

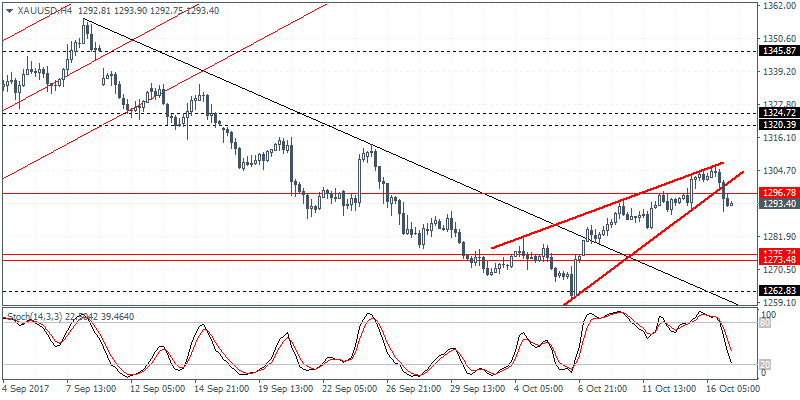
XAU/USD (1293.40):Gold prices turned bearish, and eventually price action was seen slipping to the downside from the rising wedge pattern. With the minor support level at 1296.00 being cleared, the bias remains to the downside as a result. Support is seen at 1275 - 1274 which could be the next downside target. However, in the event of a breakout above 1296.00 level, gold prices could be seen pushing higher. The next target area comes in at 1320.00 resistance level. The current breakdown comes with price action posting an outside bar on the daily session.
