A new report from an Alternative Risk Transfer research service, Artemis, looks at the catastrophe bond and insurance-linked securities market in the (record- breaking) first quarter of 2017.
Bond and ILS issuance reached the unprecedented level of $2.76 billion this Q1. That involved 25 tranches of notes from 14 deals, and it was $1.4 billion above the ten year average.
The outstanding market size as of the end of the quarter was $27.19 billion.
Q1s from the Last 10 Years
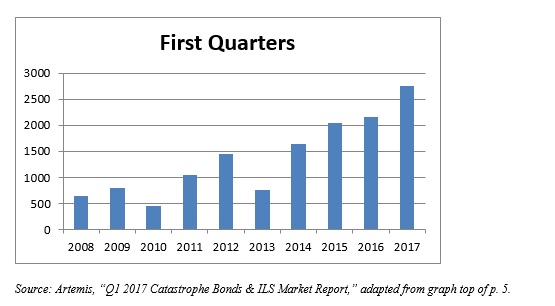
Comparing the first quarter of each of the last 10 years in this space yields the graph below.
The overall trend is one of steady growth despite two marked down moves. The fall-out from the post-quake and post-tsunami conditions in Japan may have depressed the market in the first quarter 2013 vis-a-vis the Q1s of the preceding years. But as you see, the market came roaring back.

Let’s stick for a bit with Q1 2017. In January alone there were six deals, and a little over a billion dollars of issuance. February was the slowest of the months of the quarter, with just three deals and $248 million in risk capital brought to market. It’s typical for February to constitute the doldrums of the first quarter, as shown by the Artemis Deal Directory.
Typhoons and Earthquakes
Breaking this down by peril: the largest single-peril deal in the first quarter 2017 was for Japan typhoon risk, from Sompo Japan. That deal accounted for 17% of the total.
Latin American property catastrophe risk made its first Q1 appearance in the history of the market, as did sponsor Terra Brasis Re., of Sao Paulo, Brazil. In sleepy February, Terra sponsored a $5 million transaction (Alpha Terra Validus I) with that as its underlying risk.
Terra Brasis presents itself to the marketplace as a maven of the risk scene in Brazil. Its website says it is “familiar with the peculiarities of Brazil, capable of … agile decision making processes and committed to the development of the country, serving in a wide, solid, dynamic manner all lines of business and any need of the Brazilian market.”
Speaking to a journalist recently about this Brazilian market, Rodrigo Botti, general director at Terra Brasis, emphasized the newness of the opportunity. “Brazil opened its reinsurance market just under 10 years ago,” he said.
U.S. based perils account for 25% of first quarter issuance, including such exotic perils as meteorite impact and volcano eruption, but most importantly including named storms and earthquakes.
For example, in February The Cincinnati Insurance Co. sponsored Skyline Re Ltd., Class 1, a $100 million issuance against the risk of US earthquake. In March, State Farm sponsored Merna Re Ltd., a $300 million issuance against the same risk.
Pricing Data
Pricing data is available for $2.049 billion of the cat bonds and ILS issued in the quarter. Of this, 62% ($1.26 billion) paid investors a coupon of less than 4%. Included in that is the portion that paid a coupon of less than 2%, which amounts to $680 million, or one-third of the available-data whole.
The lowest coupon (1.75%), went to investors in the Class A tranche of Vitality Re VIII notes, issued by Aetna (NYSE:AET) in January. Medical benefits claim levels are the underlying risks for these, and the expected loss is very low, the lowest expected loss on offer this quarter, just 01%. The highest expected loss on offer (8.65%) is that associated with the Class A-2 tranche of Galileo Re notes, from XL Bermuda. That is international multi-peril issuance.
Some of the securities involved suffered price decline during marketing. The $480 million Aozora Re issuance was the hardest hit in this regards, falling by 16.66%. This was the above mentioned issuance on Japan typhoon risk in March.
Where both pricing data and expected loss data are available, the average multiple of the two for Q1 2017 was 2.09.
Over the year 2016, the trend in multiples was down, so it was good news for the industry that the first quarter of 2017 represents an uptick in this regard (from Q4 1.97). This still represents decline from the 1Q 2016 figure of 2.12.
