Rolling Down Our Put Positions: When and Why?
When selling cash-secured puts, our breakeven stock price is the (out-of-the-money) strike price less the put premium. Our exit strategy guideline as to when to close the short put (buy back the put) is when share value declines to more than 3% below the strike price. Once we execute the buy-to-close trade, we no longer are committed to an option obligation and the cash used to secure the put is now freed up to secure another put. Recently, Kevin C sent me an email asking why not routinely roll down when share price declines below the 3% threshold price? Rolling down is one of our standard exit strategy considerations when share price declines in our covered call positions so why not with puts? This article will address when and why to roll down with puts and scenarios when this is not our best choice using NetApp Inc (NASDAQ:NTAP) as a real-life example.
Initial put-selling trade with NTAP
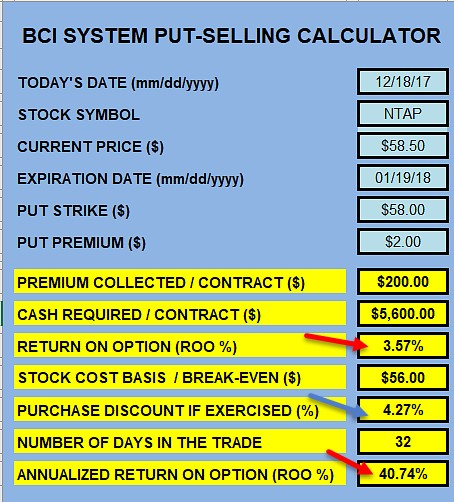
- 12/18/2017: With NTAP trading at $58.50, sell the slightly out-of-the-money $58.00 put for $2.00
- Breakeven is $56.00 ($58.00 – $2.00)
- Threshold for 3% guideline to buy back the puts is below $56.26
- 1/2/2018: Share price declines to $55.32
Initial trade calculations using the single-column BCI Put Calculator

Note the following information gleaned from the BCI Put Calculator:
- Initial 1-month time value (unexercised) return is 3.57% (40.74% annualized) a shown by the red arrows
- If the option is exercised, shares are purchased at a 4.27% discount from share price when trade was entered
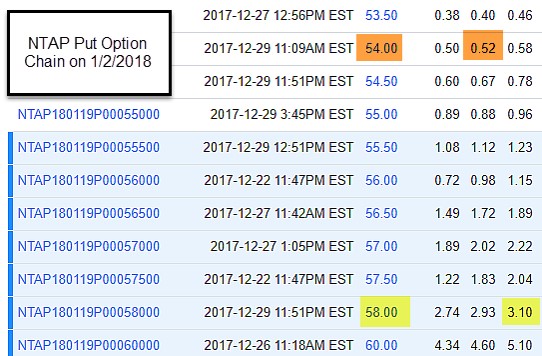
Checking the option chain when closing the initial short put

Note the following:
- The cost buy back the $58.00 put is $3.10 as shown in the yellow fields
- To roll down to the out-of-the-money $54.00 put strike we would generate $0.52 per share as shown in the brown fields
- If share price remains above the $54.00 put strike our net option loss is $0.58 per share ($2.00 + $0.52 – $3.10)
- Rolling down cuts the option loss almost in half ($1.10/$0.58)
Do we roll down routinely to mitigate losses when trades turn against us?
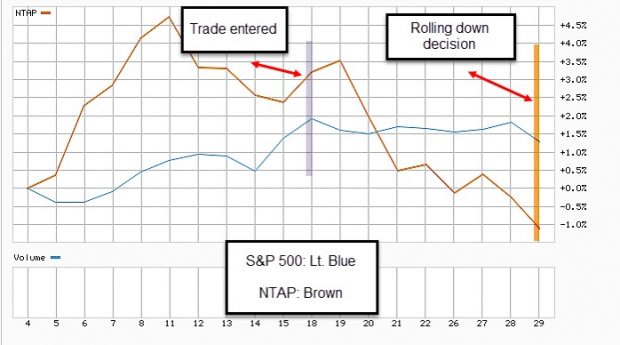
No. Although rolling down should definitely be in our exit strategy arsenal, there needs to be a thought process before making a decision to execute such a trade. With covered call writing, we own the underlying so to close a position in its entirety we would need to both buy back the option and sell the underlying. With put-selling, once we buy back the short put, we have no option obligation and do not own the underlying. Selling another option while early to mid-contract is a no-brainer, but using the same underlying is not. It is instructive to remember that the stock in question has already under-performed our expectations. Do we want to stay committed to this now under-performer? The guideline I use is a comparison of the recent performance of the stock compared to that of the S&P 500. Let’s have a look at a comparison chart of NTAP compared to the S&P 500 over the time frame of the trade to date:

Note the following:
- When the trade was entered (purple bar), NTAP (brown line) was trading above the S&P 500
- On December 20th, there was a bearish movement of NTAP price movement to below that of the S&P 500
- On 1/2/2018 (gold bar), NTAP price continued to decline and remains under the price action of the S&P 500
- Had the price movement of NTAP remained above that of the S&P 500, I would strongly consider rolling down
- In a case like this one, I would reject rolling down and enter a new put sale with a different underlying to mitigate the current loss of $1.10 per share ($3.10 – $2.00)
Discussion
Rolling down a short put is part of our position management arsenal but should be mainly implanted in scenarios when declining share price is out-performing the overall market.
Ask Alan #148: Why is this Great-performing Stock No Longer Eligible?
Upcoming event
Chicago Stock Trader’s Expo: All Stars of Options
Sunday July 22nd 12:30 PM – 1:15 PM
“How to Select the Best Options in Bull and Bear Markets”
Hyatt Regency Hotel @ McCormick (NYSE:MKC) McCormick Place
2233 South Dr. martin Luther King Jr. Drive
Chicago, IL 60616
Market tone
This week’s economic news of importance:
- Consumer credit May $25 billion ($10 billion last)
- Job openings May 6.6 million (6.8 million last)
- Producer price index June 0.3% (0.2% expected)
- Wholesale inventories May 0.6% (0.1% last)
- Weekly jobless claims 7/7 214,000 (226,000 expected)
- Consumer price index June 0.1% (0.2% expected)
- Core CPI June 0.2% (as expected)
- Import price index June-0.4% (0.9% last)
- {{ecl-381||Consumer sentiment index}} July 97.1 (98.9 expected)
THE WEEK AHEAD
Mon July 16th
- Retail sales June
- Business inventories May
Tue July 17th
- Industrial production June
- Home builders’ index July
Wed July 18th
- Housing starts June
- Building permits June
- Beige book
Thu July 19th
- Weekly jobless claims through 7/14
- Philly Fed July
- Leading economic indicators June
Fri July 20th
- None scheduled
For the week, the S&P 500 moved down by 1.50% for a year-to-date return of 4.78%
Summary
IBD: Market in confirmed uptrend
GMI: 6/6- Bullish signal since market close of July 9, 2018
BCI: Using an equal number of in-the-money and out-of-the-money strikes. Tariffs and global relationships are concerns. Anticipating another favorable upcoming earnings season.
WHAT THE BROAD MARKET INDICATORS (S&P 500 AND VIX) ARE TELLING US
The 6-month charts point to a neutral to bullish tone. In the past six months, the S&P 500 was up 0% while the VIX (12.17) moved up by 5%.
Wishing you much success,
