
Navigant Consulting, Inc. (NYSE:NCI) reported lackluster results for fourth-quarter 2017 with year-over-year decline in adjusted earnings and revenues.
Adjusted earnings were $13.8 million or 29 cents per share compared with $14.7 million or 30 cents per share in the prior-year quarter. Adjusted earnings missed the Zacks Consensus Estimate by 11 cents.
Quarterly Details
GAAP earnings for the reported quarter were $43.1 million or 91 cents per share compared with $13.5 million or 28 cents per share in the year-earlier quarter. The surge was aided by benefits from the newly enacted tax law. GAAP earnings for full-year 2017 were $75 million or $1.55 per share compared with $58.1 million or $1.19 per share in the previous year.
Total revenues for the quarter were $255.4 million compared with $266.1 million in the prior-year period. Revenues before reimbursements (RBR) were $230.7 million compared with $239.7 million in the prior-year period. Decrease in revenues across all business segments resulted in this decline. RBR missed the Zacks Consensus Estimate of $244 million. Revenues for full-year 2017 were $1,032.3 million compared with $1,034.5 million in the previous year.
Adjusted EBITDA was $32.3 million, down from $34.8 million in the prior-year quarter largely due to lower revenues.
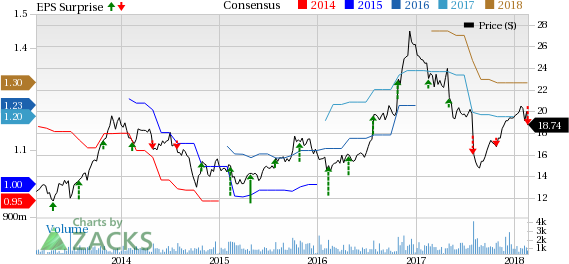
Navigant Consulting, Inc. Price, Consensus and EPS Surprise
Segment Performance
RBR for the Healthcare segment — which is one of the biggest revenue generating business of the company — decreased to $89.7 million from $91.7 million in the prior-year quarter. Discrepancies in timing and sequencing when entering long-term contracts with clients have resulted in this decline.
The Energy segment’s RBR decreased year over year to $30.7 million from $31.3 million in the reported quarter. The poor performance of this sector was caused by a decrease in activity from U.S. federal government engagements.
The Disputes, Forensics & Legal Technology (earlier known as Disputes, Investigations & Economics) segment’s RBR fell year over year to $74.6 million from $78.4 million due to decline in processing activities in the legal technology solutions business.
The Financial, Risk & Compliance Advisory segment’s RBR declined year over year to $35.7 million from $38.3 million in the prior-year quarter. This segment was adversely impacted by regulatory uncertainty and the conclusion of some large engagements at the end of the previous year.
Balance Sheet and Cash Flow
As of Dec 31, 2017, Navigant had cash and cash equivalents of about $8.4 million compared with $8.3 million a year ago. Bank debt was $133 million compared with $135 million in the year-ago period. Leverage (bank debt divided by trailing 12-month adjusted EBITDA) was 1.06 as of Dec 31, 2017, compared with 0.95 as of Dec 31, 2016.
For the quarter, net cash provided by operating activities was $70.7 million compared with $54.4 million in the year-ago quarter bringing the total tally for the year to $104.2 million and $110 million, respectively. Free cash flow increased to $24.6 million from $7.9 million in the prior-year quarter. Navigant repurchased shares worth $43.00 million at an average price of $18.52 per share in 2017. Of this, shares of about $15.00 million were repurchased at an average price of $17.89 per share in the fourth-quarter of 2017.
Full-Year 2018 Guidance
The company projects revenues to lie between $1.030 billion and $1.065 billion while RBR is expected to be $940-$975 million. Adjusted EBITDA is expected in the range of $125 million to $137 million while adjusted earnings per share are expected in the band of $1.26-$1.44. Free cash flow is expected to be between $75 million and $90 million.
Zacks Rank & Stocks to Consider
Navigant has a Zacks Rank #4 (Sell). Better-ranked stocks in the industry worth considering include CBIZ, Inc. (NYSE:CBZ) , Exponent, Inc. (NASDAQ:EXPO) and S&P Global Inc. (NYSE:SPGI) each carrying a Zacks Rank #2 (Buy). You can see the complete list of today’s Zacks #1 Rank (Strong Buy) stocks here.
CBIZ has exceeded estimates in three of the trailing four quarters with an average beat of 75.1%.
Exponent has exceeded estimates in three of the trailing four quarters with an average beat of 12.4%.
S&P Global has an expected long-term earnings growth rate of 14.5%. It exceeded estimates in each of the trailing four quarters with an average beat of 12.8%.
Today's Stocks from Zacks' Hottest Strategies
It's hard to believe, even for us at Zacks. But while the market gained +18.8% from 2016 - Q1 2017, our top stock-picking screens have returned +157.0%, +128.0%, +97.8%, +94.7%, and +90.2% respectively.
And this outperformance has not just been a recent phenomenon. Over the years it has been remarkably consistent. From 2000 - Q1 2017, the composite yearly average gain for these strategies has beaten the market more than 11X over. Maybe even more remarkable is the fact that we're willing to share their latest stocks with you without cost or obligation.
See Them Free>>
S&P Global Inc. (SPGI): Free Stock Analysis Report
Navigant Consulting, Inc. (NCI): Free Stock Analysis Report
CBIZ, Inc. (CBZ): Free Stock Analysis Report
Exponent, Inc. (EXPO): Free Stock Analysis Report
Original post
Zacks Investment Research