Get 40% Off
🚨 Volatile Markets? Find Hidden Gems for Serious OutperformanceFind Stocks Now

Natural Gas Seems Ready To Enter In A Higher Trading Zone

Published 04/28/2017, 12:43 PM
Updated 07/09/2023, 06:31 AM

Natural Gas futures price seems ready to enter into a new higher trading zone, once it closes and stays above $3.388. This is what all the bears feel to be an impossible phenomenon. But, I find it be definite one more ever than before as I have already predicted this reality through different chart patterns for different time zones since February 2017.

I constructed a “Decisive Trading Zone” while writing my analysis on February 11th, 2017. Although, my critics got a chance to criticize this analysis because the levels, I projected in this particular analysis were beyond imaginations on February 11th , 2017. I like to present the scenario of the journey of the natural gas futures price along with the current position just to explain the accuracy of this particular chart pattern in a weekly time zone on April 28th, 2017 at 12:10:00.

On analysis the movement of natural gas on April 28th, 2017 at 12:10:00 in different time zones, constructed by me while writing my last few analysis, I find the natural gas futures price going to enter into a new trading zone where all the forthcoming moves in the days ahead will be more technically prone rather than being prone to weather related announcements.

On analysis the movement of natural gas futures price from historical prospective, I find the reoccurrence of a real phenomenon many times in the past, when the bears are compelled to press the trigger of a strong bounce themselves. Now, when the majority of day traders only talk about creating shorts through different forums and they just start to criticize every analysis which even seems to favor a bullish bias in natural gas.

3rd party Ad. Not an offer or recommendation by Investing.com. See disclosure here or remove ads .

The same situation occurred on February 29th, 2016 when after a continuous downward move, the thick presence of bears compelled them to press a trigger themselves on March 1st, 2016 and a bounce back rally erupted and continued till June 27th, 2016.

The second time, the same scenario was evident on December 20th, 2016, after a long downward move and the thick presence of Bears compelled them to press the button for a bounce back and an uptrend rally started and continued till December 28th, 2016 and then the same scenario repeated on January 23rd, 2017 when the Bears were hapless to forcibly press the trigger for a bounce back on the same day and an uptrend rally continued till January 26th, 2017.

Finally, I conclude that the natural gas futures price will be seen to trade in a higher trading zone, once it successfully sustain in the mid part of the same “Decisive Trading Zone” what I constructed on February 11th , 2017 in a weekly chart for the year 2017.

Have a Nice Trading Time.

Disclaimer: This analysis is purely based on the observations. I do not have any position in natural gas. One can create position in natural gas at his/her own risk.

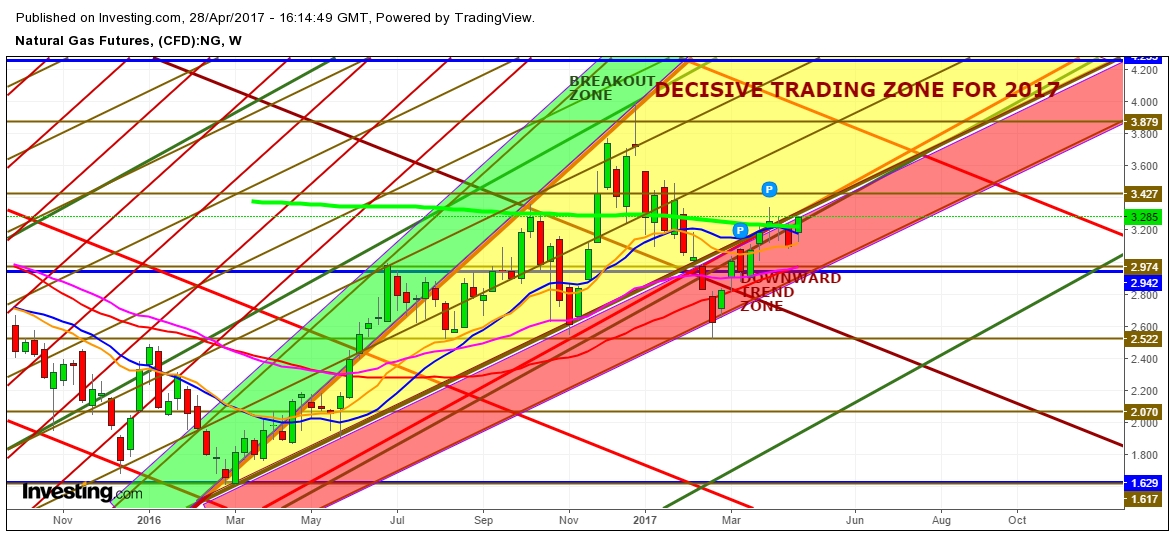
Natural Gas Weekly Chart: Decisive Trading Zone

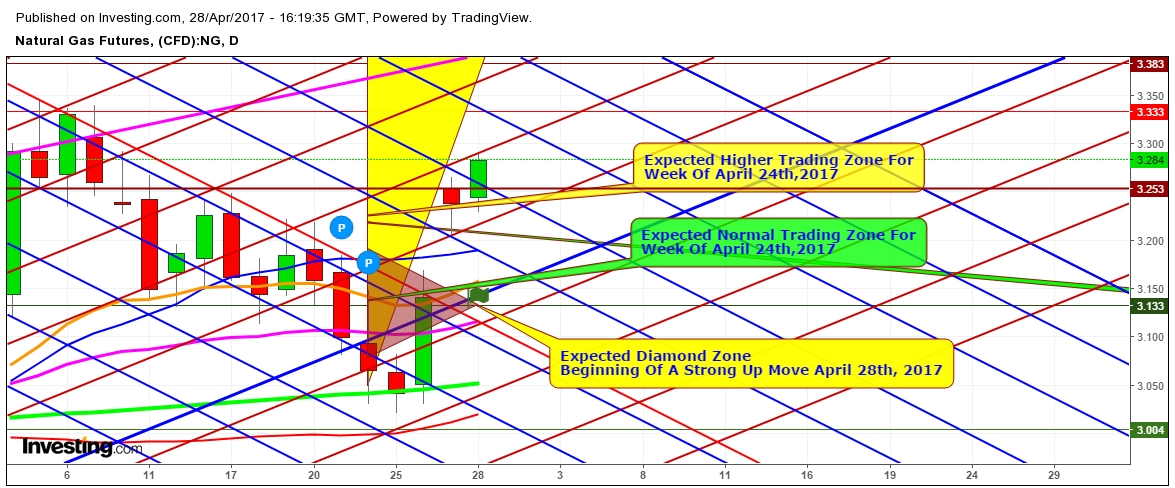
Natural Gas Daily Chart: Weekly Trading Zone


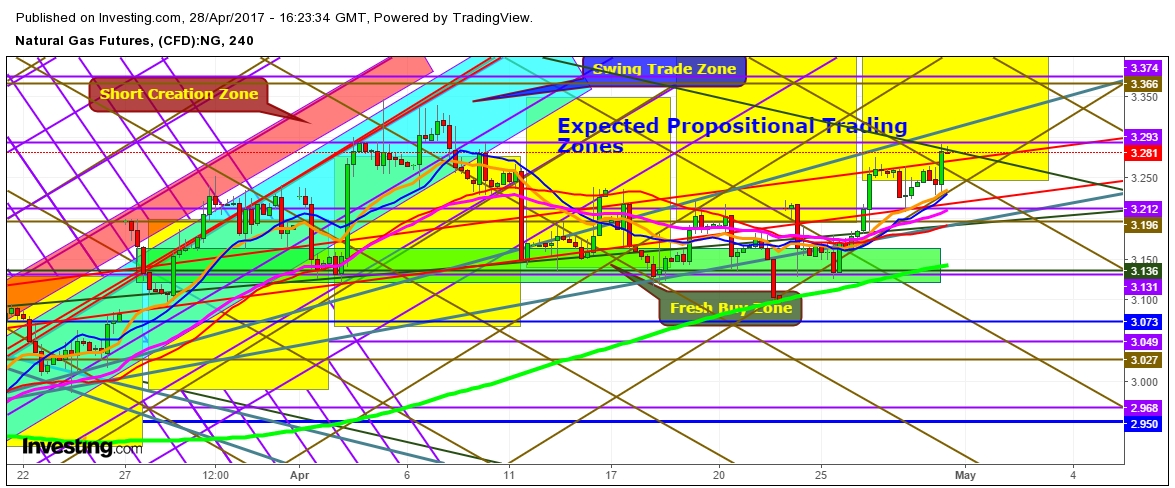
Natural Gas 4 Hr Chart: Expected Propositional Trading Zones

Latest comments

He's a permabull and he's also wrong. Natgas production is exploding. We'll see 2.8 tested soon
I have been watching your analyses for the last weeks, Maybe months and you have been on the spot. I Agree that NG 3.60 is in play currently If iT manages to break and stay above 3.35 confidently. I melyself had last week targets to be 3.16, 3.27 and 3.34 as Pivotal. IT smashed though the first 2 targets But friday I noticed the upward rally lost steam and cut half If my longs as I even expect a minor GAP down today. I also expect a pullback to may futures Closing priced. The question whether there are still many buyers left bugs me and the fact that CTC reports a real dominance of long players, profit taking could soon reverse the trend.
Risk Disclosure: Trading in financial instruments and/or cryptocurrencies involves high risks including the risk of losing some, or all, of your investment amount, and may not be suitable for all investors. Prices of cryptocurrencies are extremely volatile and may be affected by external factors such as financial, regulatory or political events. Trading on margin increases the financial risks.
Before deciding to trade in financial instrument or cryptocurrencies you should be fully informed of the risks and costs associated with trading the financial markets, carefully consider your investment objectives, level of experience, and risk appetite, and seek professional advice where needed.
Fusion Media would like to remind you that the data contained in this website is not necessarily real-time nor accurate. The data and prices on the website are not necessarily provided by any market or exchange, but may be provided by market makers, and so prices may not be accurate and may differ from the actual price at any given market, meaning prices are indicative and not appropriate for trading purposes. Fusion Media and any provider of the data contained in this website will not accept liability for any loss or damage as a result of your trading, or your reliance on the information contained within this website.
It is prohibited to use, store, reproduce, display, modify, transmit or distribute the data contained in this website without the explicit prior written permission of Fusion Media and/or the data provider. All intellectual property rights are reserved by the providers and/or the exchange providing the data contained in this website.
Fusion Media may be compensated by the advertisers that appear on the website, based on your interaction with the advertisements or advertisers.
© 2007-2024 - Fusion Media Limited. All Rights Reserved.