Get 40% Off
🚨 Volatile Markets? Find Hidden Gems for Serious OutperformanceFind Stocks Now

Natural Gas June In Sideways Trend, Resistance At 288-289 Levels

Published 06/23/2014, 05:37 AM
Updated 05/14/2017, 06:45 AM

Natural Gas prices to find support in the range of 268 - 267 levels. Trading consistently below 267 levels would lead towards the strong support at 262 levels and then finally towards the major support at 255 levels.


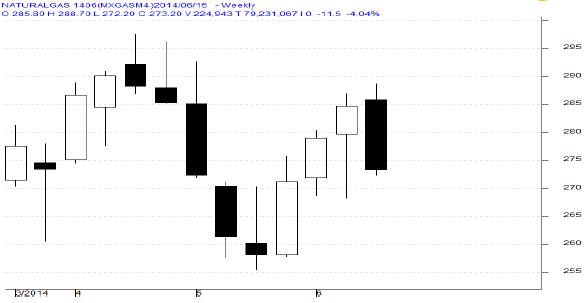
MCX Natural Gas June as seen in the weekly chart above has opened the week at 285.80 levels and made a high of 288.70 levels. During this week prices could not able to sustain on the resistance zone of 288 – 290 levels and sharply corrected towards the weekly low level of 272.20 levels. This week prices have closed below the previous week’s closing level of 284.70 levels and finally closed 4.04% lower at 273.20 levels. Technically, prices have formed “Bearish candlestick pattern” which is the sign of pessimism.

For the next week we expect Natural Gas prices to find support in the range of 268 - 267 levels. Trading consistently below 267 levels would lead towards the strong support at 262 levels and then finally towards the major support at 255 levels.

Resistance is now observed in the range of 288 - 289 levels. Trading consistently above 289 levels would lead towards the strong resistance at 295 levels, and then finally towards the major resistance at 305 levels.

MCX / NYMEX Natural Gas Trading levels for the week

Trend: Sideways

S1 - 267 / $ 4.40 R1 - 289 / $ 4.80
S2 - 262 / $ 4.20 R2 - 295 / $ 4.95

Latest comments

Risk Disclosure: Trading in financial instruments and/or cryptocurrencies involves high risks including the risk of losing some, or all, of your investment amount, and may not be suitable for all investors. Prices of cryptocurrencies are extremely volatile and may be affected by external factors such as financial, regulatory or political events. Trading on margin increases the financial risks.
Before deciding to trade in financial instrument or cryptocurrencies you should be fully informed of the risks and costs associated with trading the financial markets, carefully consider your investment objectives, level of experience, and risk appetite, and seek professional advice where needed.
Fusion Media would like to remind you that the data contained in this website is not necessarily real-time nor accurate. The data and prices on the website are not necessarily provided by any market or exchange, but may be provided by market makers, and so prices may not be accurate and may differ from the actual price at any given market, meaning prices are indicative and not appropriate for trading purposes. Fusion Media and any provider of the data contained in this website will not accept liability for any loss or damage as a result of your trading, or your reliance on the information contained within this website.
It is prohibited to use, store, reproduce, display, modify, transmit or distribute the data contained in this website without the explicit prior written permission of Fusion Media and/or the data provider. All intellectual property rights are reserved by the providers and/or the exchange providing the data contained in this website.
Fusion Media may be compensated by the advertisers that appear on the website, based on your interaction with the advertisements or advertisers.
© 2007-2024 - Fusion Media Limited. All Rights Reserved.