
It appears that natural gas went from five months of steady declines to a bouncing ball. The energy commodity that is like crack cocaine because of its attraction to market participants that thrive on volatility looks awful when falling and sexy when rallying.
After falling back below $1.60 last week, the price rallied back to a high of $1.889 this week. The energy commodity ran out of upside steam and was back at the $1.70 level on May 21. The price variance in the energy commodity is offering bulls and bears that have their fingers on the pulse of the market plenty of profitable opportunities these days.
On Thursday, May 21, the Energy Information Administration released its latest inventory data for the week ending May 15. After two consecutive weeks of triple-digit injections into storage, the market expected a slightly lower inventory build. The United States Natural Gas Fund (NYSE:UNG) tracks the price of the energy commodity higher and lower. The natural gas addicts prefer the short-term (NYSE:UGAZ) and (NYSE:DGAZ) products as they turbocharge the price action with an added dose of volatility.
The Market Expected A 98 bcf Injection
According to the crowdsourcing Website Estimize, the market had expected an inventory build of just below 100 billion cubic feet for the week ending May 15, going into the weekly data report from the Energy Information Administration.
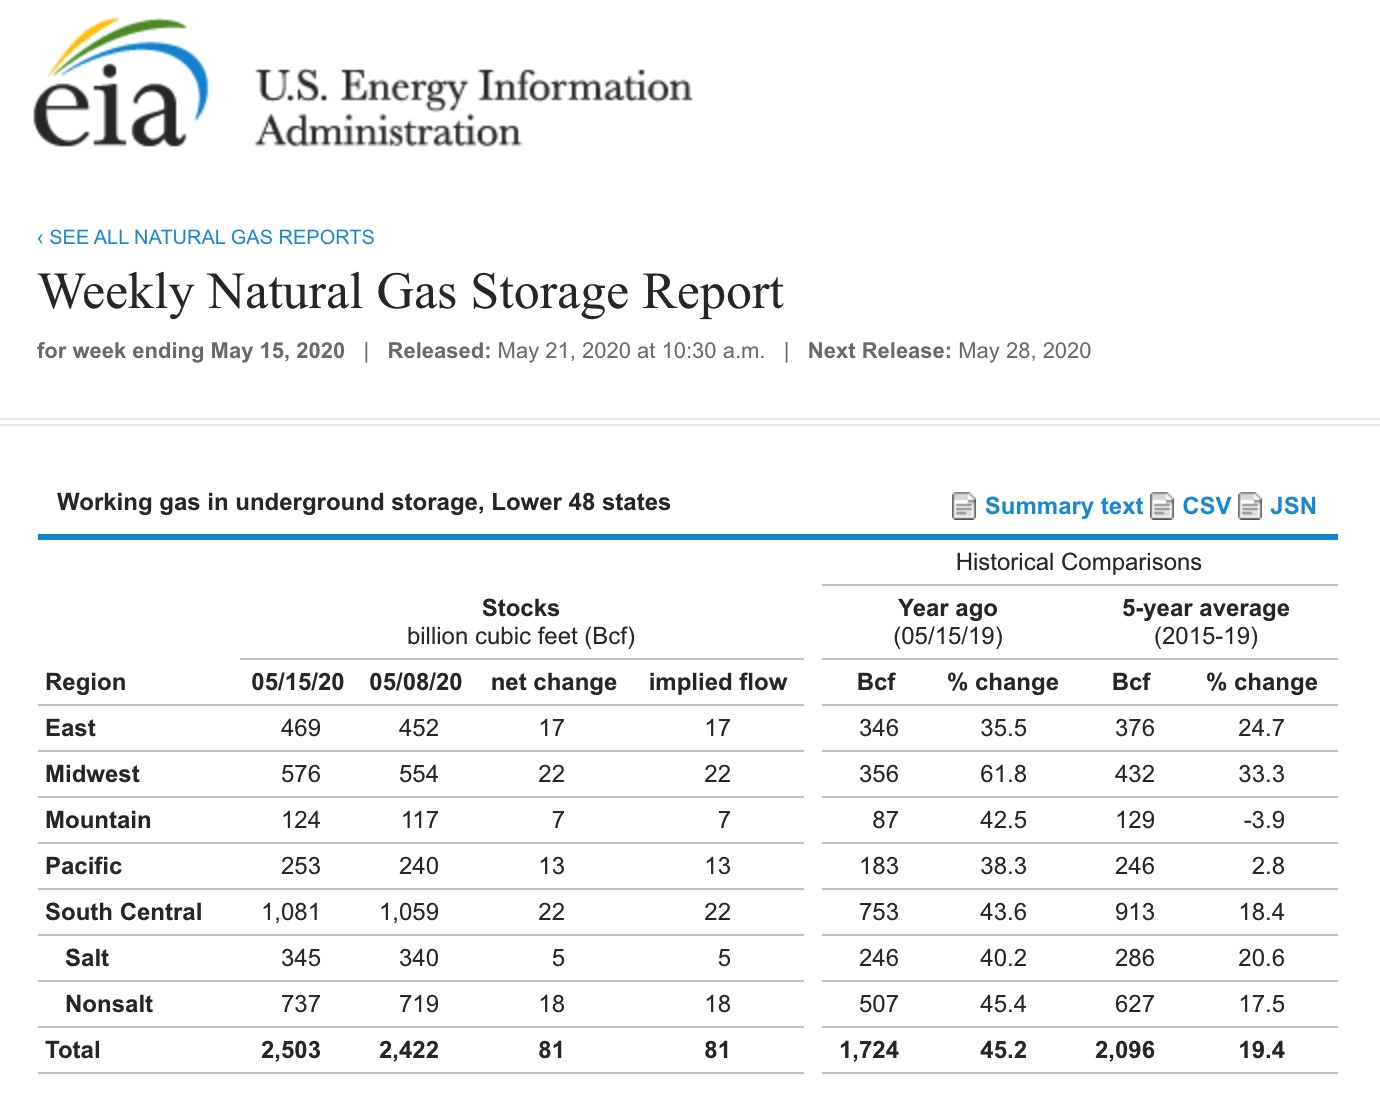
(Source: EIA)
As the chart highlights, 81 bcf flowed into storage for the week ending May 15. Total stockpiles stood at 2.503 trillion cubic feet, 45.2% above last year’s level, and 19.4% higher than the five-year average for this time of the year.
(Source: EIA)
As the 10-minute chart illustrates, despite the lower than expected build in stockpiles, the price action was bearish after the latest inventory data from the EIA.
Trend Continues
The percentage over the five-year average fell from 49.2% over the level from the week ending on May 8. The trend lower continued, as the May 15 data marked the ninth consecutive week.
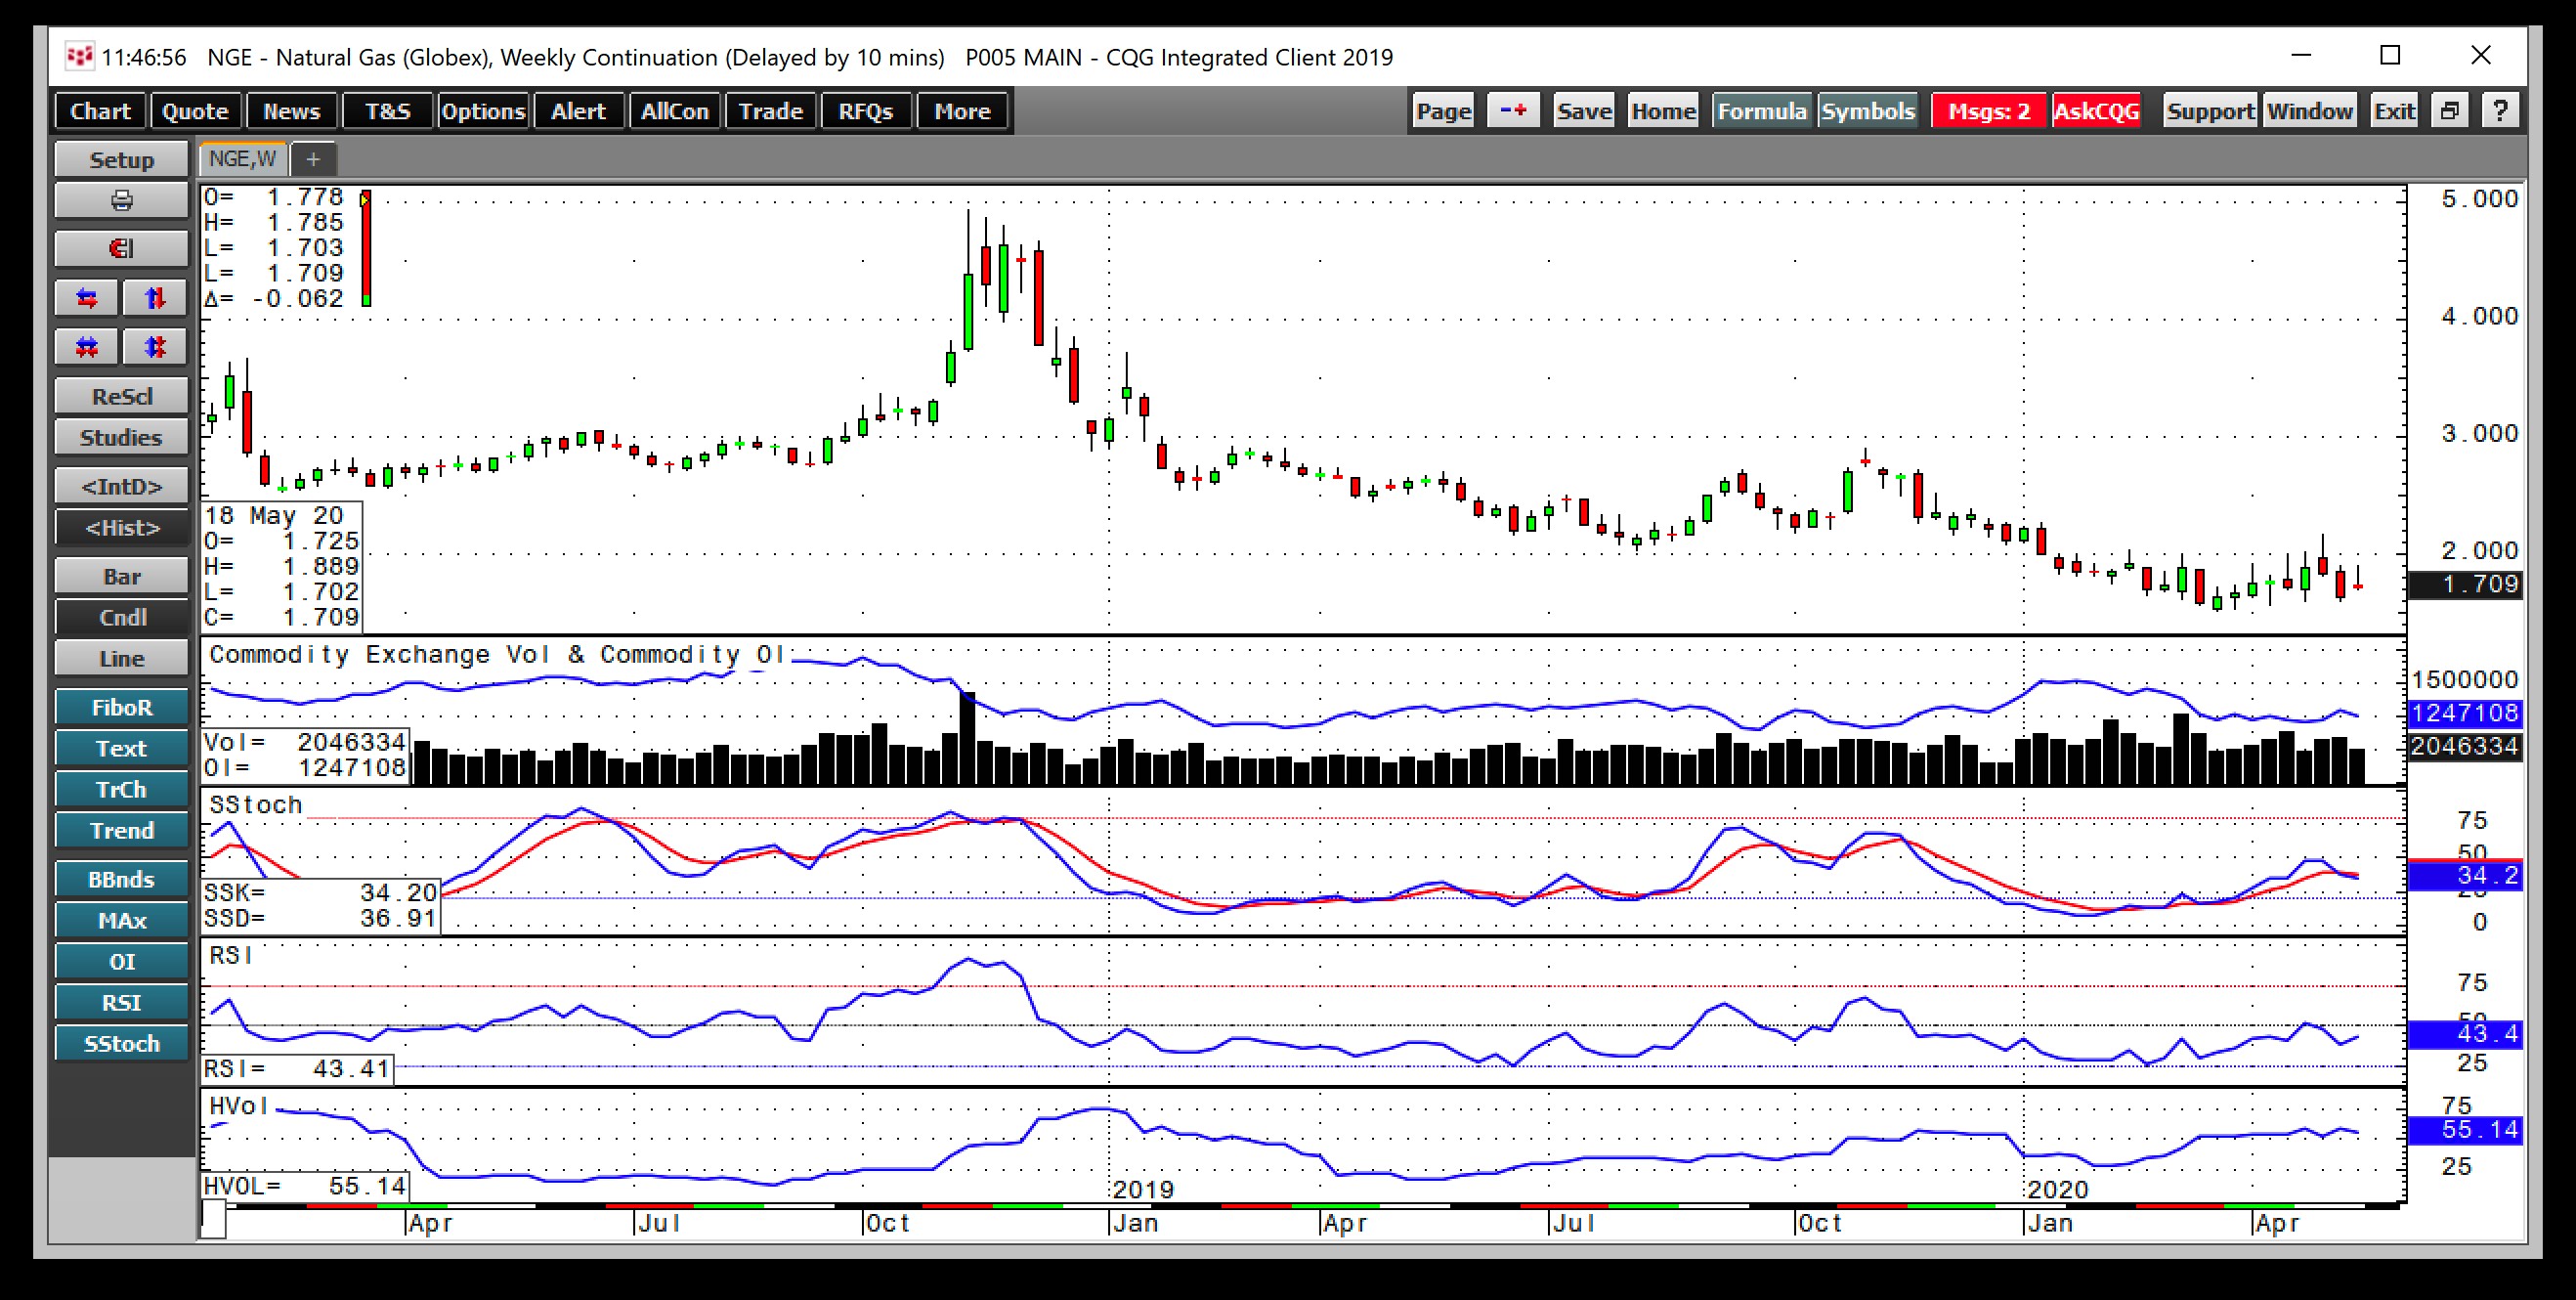
(Source: CQG)
The weekly chart shows that natural gas broke out of the bearish trend from November to March when the price rose to a high of $2.162 in early May. The price then fell to a higher low of $1.595 last week, bounced to $1.889, and failed. After the latest data, which was not bearish, the price was back at just over the $1.70 level on Thursday, May 21.
Price momentum and relative strength metrics were below neutral readings on Thursday. Weekly historical volatility at over 55% remained near the highs of 2020 as weekly trading ranges have been wide. Open interest at 1.247 million contracts as of May 20 was below last year’s level at 1.312 million. The weekly chart displays a market that is likely to remain in a tightening price range.
Natural Gas Rejects Lows And Highs
When it comes to the path of least resistance for the price of natural gas over the coming trading sessions, the $1.595 to $2.162 per MMBtu trading range since May 6 is likely to remain intact for the near term.
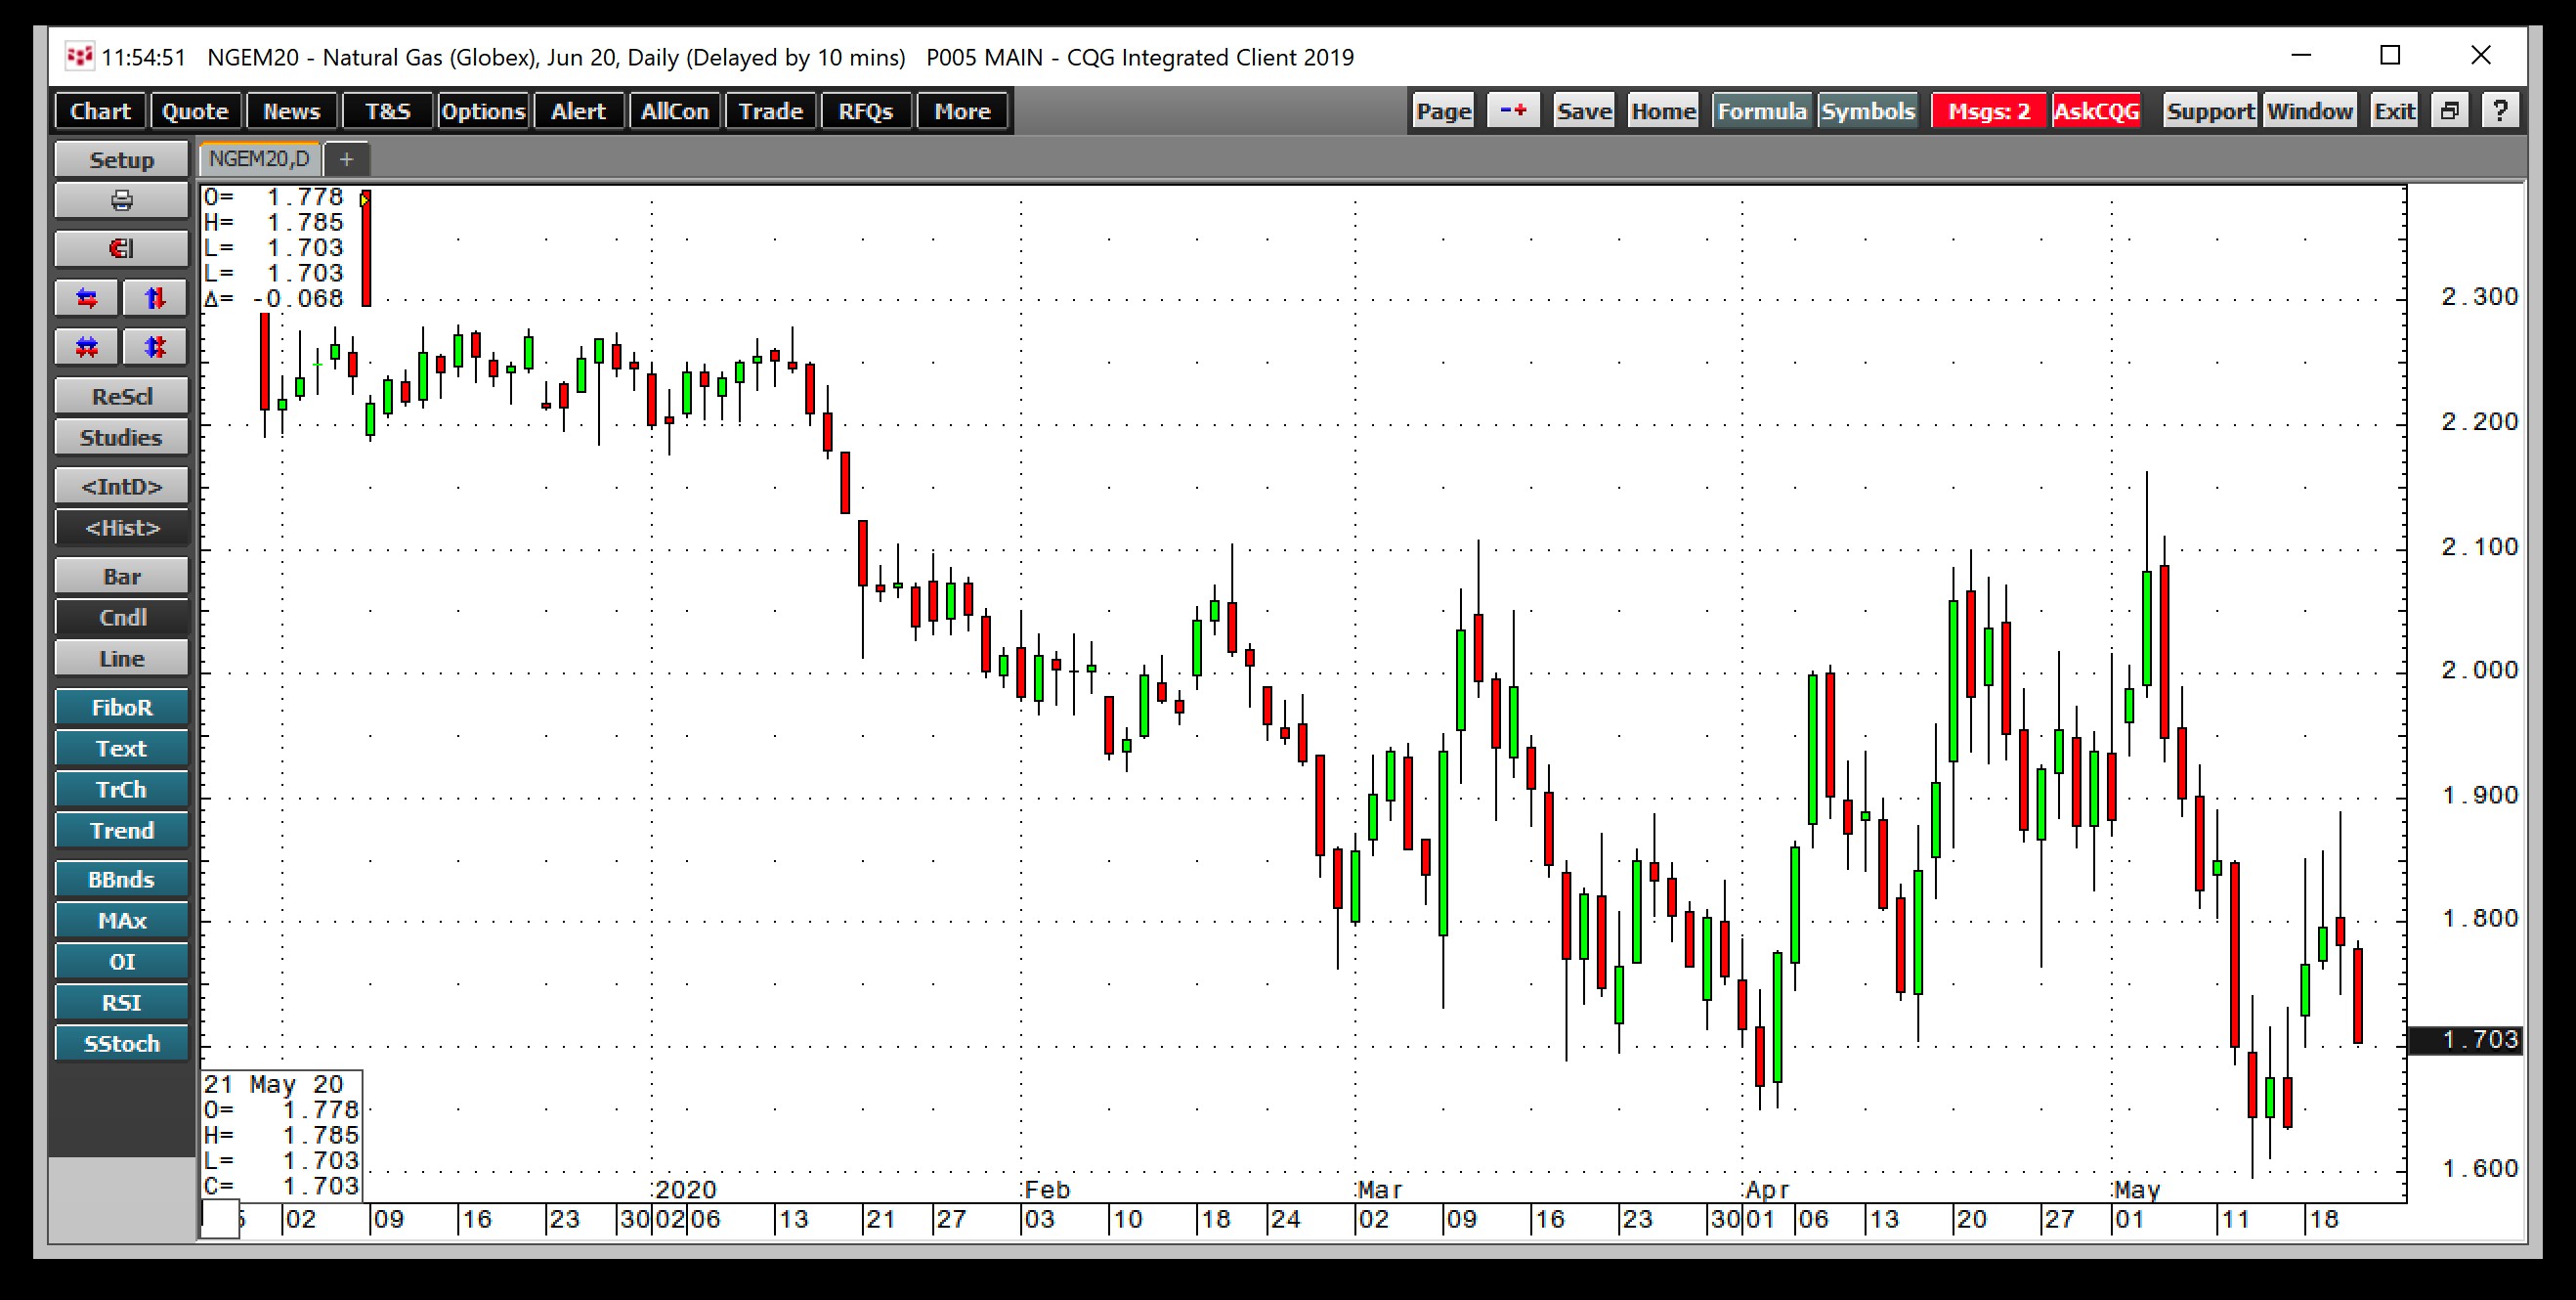
(Source: CQG)
The mid-point stands at $1.879 per MMBtu. Buying scale-down below the pivot point and taking profit above is likely to be the optimal approach to the natural gas market. At just over $1.70 on March 21, natural gas is back in the buy zone.
The United States Natural Gas Fund was trading at $11.33 per share on Thursday afternoon, down $0.46 (-3.90%). Year-to-date, UNG has declined 51.42%, versus a 10.94% rise in the benchmark S&P 500 during the same period.
UNG currently has an ETF Daily News SMART Grade of F (Strong Sell), and is ranked #66 of 112 ETFs in the Commodity ETFs category.