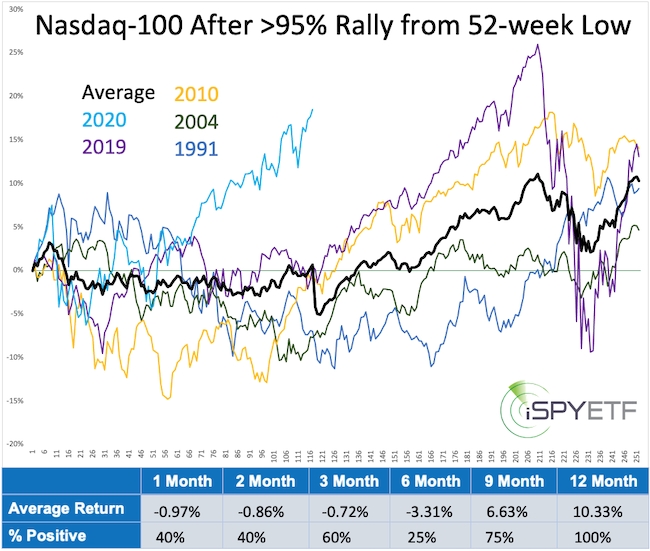
The NASDAQ 100 is the second major index to double in value since the March 2020 low. History shows that a NASDAQ double usually leads to short-term trouble.
Based on intraday prices, the NASDAQ 100 soared as much as 103% from March 2020 to February 2021. Based on daily closing prices, the NASDAQ100 gained as much as 95.80%. The same is true for the Invesco QQQ Trust (NASDAQ:QQQ).
Since 1985, the NASDAQ 100 rose 95% or more from a 52-week low 5 other times. Previous signal dates (when the NASDAQ 100 crossed the 95% threshold) are:
2/8/2021, 8/21/2020, 4/22/2019, 4/14/2010, 11/17/2004, 12/30/1990.
The chart below shows the forward returns for the year following the respective signal date. Here are the key takeaways:
- Average forward returns (black line and bottom panel performance tracker) were rocky for the first 6 months following the signal.
- In 2020 and 1991, the Nasdaq-100 kept going, but at some point over the first 5 month each prior instance gave back all gains and lost at least 5% from the signal date.
- 1 year later, the NASDAQ 100 was up every time with an average return of 10.33%
Can the NASDAQ 100 overcome the bearish short-term implications?
Expect the Unexpected?
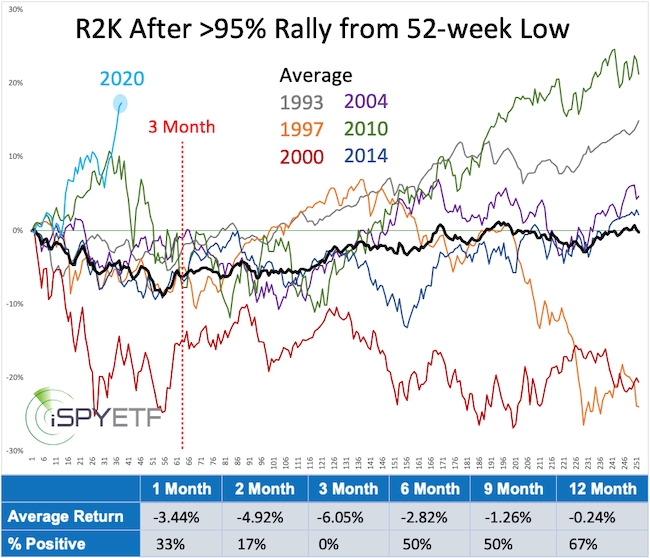
The Russell 2000 and iShares Russell 2000 ETF (NYSE:IWM) already completed their double in December 2020, and let's just say what happened since did not repeat or rhyme with history.
The Russell 2000 rallied 95% from a 52-week low 6 prior times. The chart below shows the 1-year forward returns for all instances, including the performance since the most recent signal date (12/15/2020).
As the bright blue line shows, the Russell 2000 just kept going after the last double and blew all historic precedents out of the water.
Similar to the NASDAQ 100 study, the Russell 2000 had consistent trouble to hold on to its gains. There is a particularly pronounced 'performance pothole' 3 months after the signal date, which equates to March 2021.
3-Step Parachute
Although the NASDAQ double does project trouble, there's no reason to hit the panic button or pull the ripcord (yet). Considering strong market breadth and momentum, it’s smart to have a 3-step ‘parachute:’
- Watch potential risk signals: Excessive optimism, negative studies, declining breadth and momentum, negative divergences are tell tale signs of a looming correction. We are are seeing some of those signs, so be alert.
- Watch chart support: A break below important chart support likely means a correction has started.
- Once support is broken, pull parachute ripcord and protect against a deeper correction.
