Get 40% Off
🚨 Volatile Markets? Find Hidden Gems for Serious OutperformanceFind Stocks Now

NASDAQ 100 Update: Will It Ever Go Down Again?

Published 09/01/2020, 05:01 PM
Updated 07/09/2023, 06:31 AM

The Nasdaq 100 has certainly surprised many to the upside, me included.

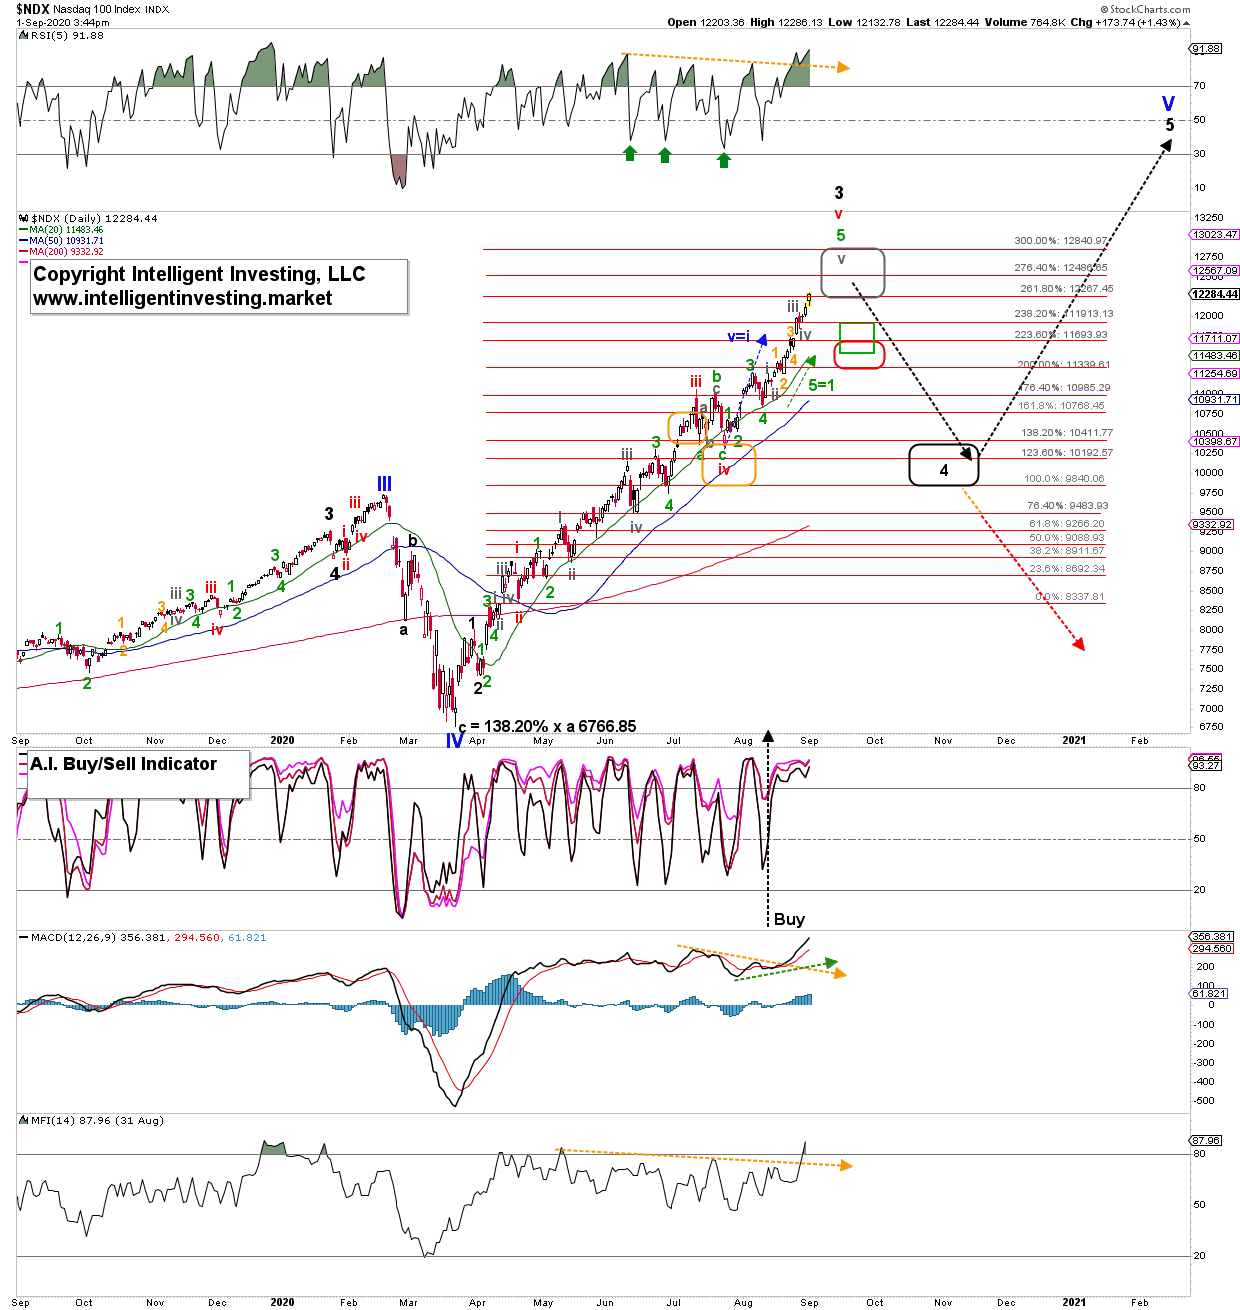
My first ideal upside target zone was for many weeks $11,600-$11,700. It was easily reached. Then, as that zone was exceeded, and although I found it less likely based on applying normal wave-relationships (dotted green, and blue arrows) and not extended wave-paramaters, I was looking for $11,880 to be reached for a larger top. Also, this has now been exceeded as the waves continue to subdivide higher. See Figure 1 below.

As I said in prior updates,“Subdividing waves occur often in the third wave or fifth wave. However, one simply cannot know before hand which of the two waves will subdivide. And even then both waves can subdivide. That is why all one can do is:

  • anticipate (expect regular wave-relationships), then
  • monitor (is price adhering to these anticipated regular relationships), and
  • adjust if necessary (if not, then re-assess the waves and price targets).

The exceeding of price targets does not mean the Elliott Wave Principle is wrong or does not work. Quite the contrary. I was able to forecast these price targets would be reached. I simply did not have the data and tools available at the time to be able to foresee extensions of the waves. Because, remember, the market is a dynamic, ever-changing environment. It is never static. Hence, one must adapt one’s point of view as new price data becomes available. This is not an excuse, but an explanation of how markets work.

Figure 1. NDX 100 daily candlestick chart with EWP count.
3rd party Ad. Not an offer or recommendation by Investing.com. See disclosure here or remove ads .

NDX 100 Daily Candlestick Chart With EWP Count.

The markets are like forecasting the weather. Weather is also a dynamic, stochastic system. If rain is forecasted for tomorrow and it rains, then the forecast was correct. But, it can rain more or less than originally was anticipated 24 hours before. This change can happen for many reasons; e.g., the weather system stalled out over the sea and picked up more moisture, or it rained out before reaching your home as it got lifted to higher altitudes.

The NDX reached the ideal (orange) target zones for (red) wave-iii and iv in July, and behaved until then very nicely granted wave-iii exceeded the zone but only for a day on a closing basis. When the NDX 100 bottomed right at the upper end of the wave-iv target zone, I could by no means know the current wave-v would extend as much as it has. I cannot predict the future, I can only make forecasts based on standard wave-relationships; e.g. the blue dotted arrow, for example. Neither does it mean that if a price target zone is reached, one should go short. The index will have to first break below prior support to tell us the uptrend has ended. Trading is not the same as forecasting. But what one can do is lighten up on long positions and/or move stops up as it is always prudent to be cautious, nimble and to protect hard-earned profits.

Thus, as all “regular” upside targets have been breached (red and green target zones), we now need to set sail for the next higher Fib-extension targets: grey box at $12,846-$12,860.

3rd party Ad. Not an offer or recommendation by Investing.com. See disclosure here or remove ads .

Bottom line: Over the last few weeks I “expect a more important top by late-August early-September, followed by a rough two months for stocks in general heading into the U.S. Presidential Elections.” So far, this path appears to be still travelled by the market and I see no reason to change that view. However, my 10-15%/1.5-2.5% risk/reward perspective from last week was wrong, and thus, with the new price data at hand, I update the R/R to: 15-20% / 1.5-4.5%.

Why such a high risk? Because the index is currently, IMHO, in an extended fifth wave, and those are often fully retraced during the next correction. For now, as long as last Thursday’s low (grey wave-iv) holds, I expect higher prices.

As usual, know your timeframe, trading/investing style, and always act accordingly.

Latest comments

5% drop! more to come?
Just Dropped To $12400
Doc, can’
Doc, can't see you were wrong here.
 thanks, well it didn't top in the expected zone, that's where I was wrong.
prediction is an art. you can't make excuses.
I'm not sure what you are trying to say here ?   Prediction IS an art and it may or may not happen.  He Predicted based on what he was seeing and giving his interpretation of what he sees.  He makes it very clear that it may or may not happen.  There were no excuses made and none needed  No one can tell you with any certainty and be completely correct every time.  He led you down the right path when things change you have to be able acknowledge the change and understand that an alternate scenario is taking place.
Fake news, the enemy of the people , Donald Trump
You're a clever man. At least, you agree that you don't have all the datas and that makes trading forecast as difficult as weather forecast. It's not ever easy to say 'I was wrong', especially in a world of ego such as the world of traders. You were right about the upside move, but wrong to anticipate the top. That shows that the market price is corrupted at this time with the actions of central banks, especially the FED. Their balance sheet shows us that the trillions of new printed dollars are mostly used to fuel the markets. They almost doubled it (7200 billions) in 6 months while it took them 12 years to reach 4000 billions (2008-2020). Easy to predict the upside, uneasy/impossible to say when the pullback will occur.
thank you. Indeed, I sure don't have all the answers and tools available to nail every twist, turn, top and bottom. Nobody has. We'll see how this ends. Enjoy it while it lasts!?!
Everybody is chasing fewer and fewer stocks. Of course the money managers have to jump on everything because it is going to the moon. One thing I realized over many years is that you cannot anticipate a top. But when it comes, it will be ugly, just sit and watch make new highs, then a nice double top on a 60 or 120 minute chart, the speed the market is moving now means it is not far away.
agree, its all about patience and good setups. chasing is never a good setup.
biden is the next president. the closer we get to the election the more likely we will start to have some downside movement.
Bubbles pop. There’s your next article. Powell has created it. Like Greenspan, he’ll just mumble something about irrational exuberance and fade into the sunset. Powell is a moral hazard, and so is the guy who hired him and forced him to kowtow to keep his job. Powell sold his soul in December 2018. All of Us will pay the price for his lack of integrity.
Couldnt agree more. But all greedes here are riding the nasdaq rally buble and could care less about the millons who will pay for the party
how do we get your tweets of trades
Hi Morris, you can sign up here: https://intelligentinvesting.market/swing-trading-on-twitter/
NASDAQ will fall for sure, its RSI is (when I am writing 9:50 PM) = 83 (overbought) so, it will drop either to the 50 MM or to the 23 Fibonacci retracement level.
I give up today. I kept shorting it. It feels like p/i/ssing against the wind.
I did the same with Silver in the last bull run and lost, don´t short, just wait for the drop and then go long.....the trend is your friend!
Don't give up yet! We're so close. I can't help but think Xi might have a surprise up his sleeve for Trump on the 20th of Sept. Check out QID, inverse trading on the NASDAQ. Calls 2 dollars out are dirt cheap! Keep in mind while strategizing, that under normal trading conditions, shares of QID move .25 for every 1% that the NASDAQ moves. Good luck!!
NASDAQ will hit 14000. Will there be a correction? None in sight until Oct.
It probably has something to do with either zooms *****out earnings or apple and teslas stock split
thanks. although the why is not really important, I agree these factors (and many others) all play an important role.
Forecasting weather is more scientific, and easier nowadays. Predicting markets, which is cumulative human (+algos) behavior reflected in the price, is way more difficult.  I could see 12300+, now I would not be surprised by 12900 also (2.0 fib extension with some overshoot)
agree. there are likely more variables going into the markets then into weather, but it was simply an analogy to show how stochastic systems work and why they can never always be correctly forecasted. we'll take it Fib-extension by extension until support is broken. thanks!!
Typical chaotic system. Trying to predict what will happen next week (not next month) is an illusion. We can't. Even trendlines (up or down ???) are wrong. It's not your fault or anyone else, but we have to realize that these tools are not so useful as we THOUGHT they are.
When do you think is the correction? This month? Some analysts say not before October. Very confusing.... thanks
preferably september-october, but we need to see break of support first (last Thursday's low for starters) to know the correction has likely begun.
Dr Arnour, I really appreciated you recognize mistakes. So I do really follow you for being honest and you are usually right . Thanks.
thank you. yes I was wrong in my R/R analyses. Admitting mistake is the only way to continue to learn and improve.
Now that It broke above last fib level is it implied that it will test the next fib level or can it stall mid way ?  Is it more common to follow thru to test next fib above or percentage wise is both occur almost equally ?
 Hi Anthony, yes consistency is most traders downfall, it is all tight to being disciplined and to not trade on emotions but based on proven, tested, well-planed price entry and exit points.
Hi Dr. Arnout ter Schure , I have a question I hope it is ok to ask.  I was just drawing some fibs and did some from closer points 11058.5  to 10301 the point of double top at 278.6 = 12411.40  fib and 11283.25 to 10845.50 361.8 fib =12429.28  do these closer fibs have any value as they are in the vicinity of the current price or is the larger one 9726.95 to 6644.40 the one to follow.  How do you know which will carry the most weight ?
  I do not know if the above created an alert to you just wanted to resend
Risk Disclosure: Trading in financial instruments and/or cryptocurrencies involves high risks including the risk of losing some, or all, of your investment amount, and may not be suitable for all investors. Prices of cryptocurrencies are extremely volatile and may be affected by external factors such as financial, regulatory or political events. Trading on margin increases the financial risks.
Before deciding to trade in financial instrument or cryptocurrencies you should be fully informed of the risks and costs associated with trading the financial markets, carefully consider your investment objectives, level of experience, and risk appetite, and seek professional advice where needed.
Fusion Media would like to remind you that the data contained in this website is not necessarily real-time nor accurate. The data and prices on the website are not necessarily provided by any market or exchange, but may be provided by market makers, and so prices may not be accurate and may differ from the actual price at any given market, meaning prices are indicative and not appropriate for trading purposes. Fusion Media and any provider of the data contained in this website will not accept liability for any loss or damage as a result of your trading, or your reliance on the information contained within this website.
It is prohibited to use, store, reproduce, display, modify, transmit or distribute the data contained in this website without the explicit prior written permission of Fusion Media and/or the data provider. All intellectual property rights are reserved by the providers and/or the exchange providing the data contained in this website.
Fusion Media may be compensated by the advertisers that appear on the website, based on your interaction with the advertisements or advertisers.
© 2007-2024 - Fusion Media Limited. All Rights Reserved.