Get 40% Off
⚠ Earnings Alert! Which stocks are poised to surge?
See the stocks on our ProPicks radar. These strategies gained 19.7% year-to-date.
Unlock full list

NASDAQ 100 Update: Is The Bull Market Over?

Published 03/05/2021, 03:09 PM
Updated 07/09/2023, 06:31 AM

In last week’s article, I concluded for the Nasdaq 100, based on the Elliott Wave Principle and technical analysis:

Although not necessary, a last intra-day stab lower to SPX12710+/-10 within the next few days can be allowed for, and thus this week’s triple bottom should hold on a daily closing basis. If not, a larger flush down to 12200, based on simple symmetry, cannot be excluded. Even such a big pullback would still not invalidate the EWP count as shown, for as long as the (red) intermediate wave-i made on Oct.12, 2020, at 12187 is not exceeded to the downside. Why? Because in an EWP standard impulse, a 4th low and 1st wave high are not allowed to overlap. If that happens, I must adjust my thinking and accept that a much larger top may already have been struck.”

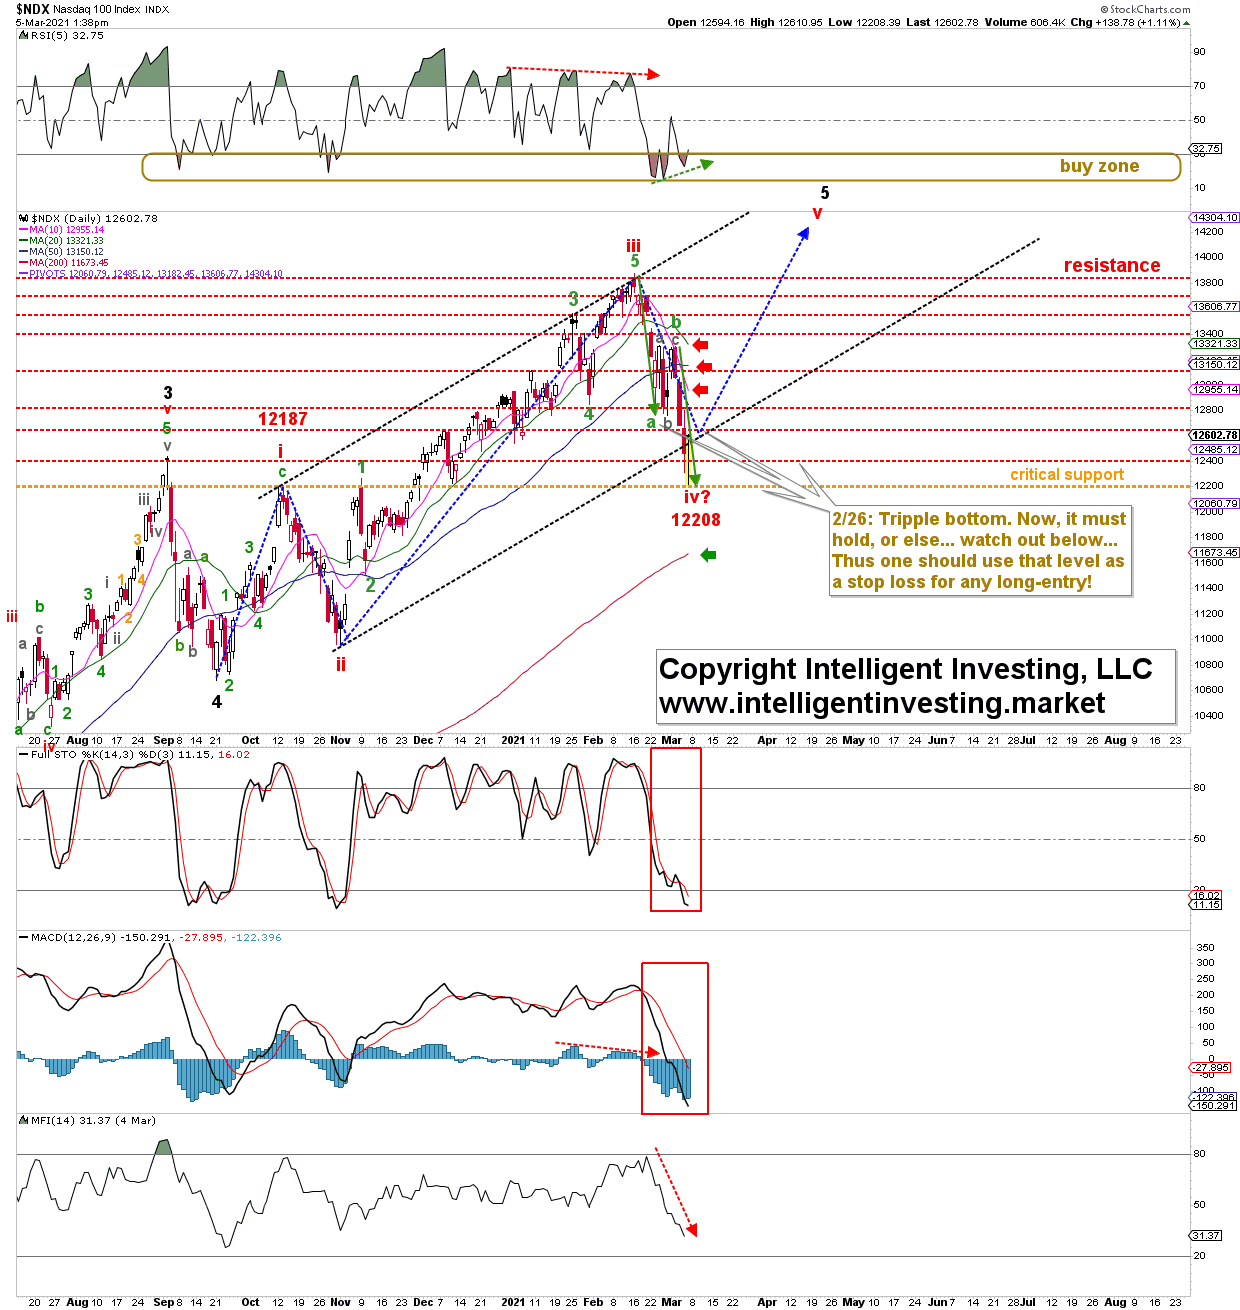
One week later and here we are: Last week’s triple bottom did not hold, and 12200 came in rapid order as the index moved to as low as 12208 this morning. See Figure 1 below.

What happened?

Last week’s triple bottom, combined with this Monday’s high formed a complex minor b-wave (in green). After a B-wave always follows a C-wave, and the break below last week’s triple bottom, which I suggested last week should be used as a stop loss for any long positions, ushered in the minor green wave-c down. C-waves are often equal to the prior A-wave: green arrows. And thus, last week’s warning came to fruition: “This week’s triple bottom should hold on a daily closing basis. If not, a larger flush down to 12200, based on simple symmetry, cannot be excluded.” 

Figure 1. NDX100 daily candlestick chart with EWP count and technical indicators.
Nasdaq 100 Daily Candlestick Chart. 

The other critical part of last week’s conclusion is “the (red) intermediate wave-i high made on Oct. 12, 2020, at 12187 is not to be exceeded to the downside. Why? Because in an EWP standard impulse, a 4th low and 1st wave high are not allowed to overlap. If that happens, I must adjust my thinking and accept that a much larger top may already have been struck.”

With today’s low at 12208, the bulls hang with one finger on the edge of the cliff. Thus, the ideal downside target of 12800-13200 was exceeded, resulting in the market gunning for its symmetry target at 12200. That was achieved today, underscoring the market does not have to be ideal, textbook and picture-perfect. It does what it does, but will still adhere to the EWP. All we, as market participants, can, therefore, do is “anticipate, monitor, adjust if necessary,” see below for the stages of applying the EWP to the recent market:

  • I anticipated 12800-13200 to be reached. That was achieved last week: perfect. The question remained: “Is the wave-iv low in? Likely, but only if the triple bottom holds!”
  • I then monitored for a possible break of that triple bottom. It did not hold and it broke.
  • I then adjusted as necessary with new anticipation: “The wave-iv low was not in: expect 12200 to be reached based on simple C=A symmetry.” That was achieved today: perfect. Critical criteria remain: “But today’s low and 12187 need to hold. Otherwise, a much larger top has been struck.”

The above is the proper way to apply the EWP to analyze and forecast the markets, use it for trading (appropriate stop levels), and remain objective and factual. It is not moving the goalpost, but knowing the markets is all about the probabilities of possibilities. When we are dealing with a probabilistic environment, we must apply “if/then” scenarios. The EWP is an excellent tool for that.

Bottom line: Last week’s triple bottom did not hold, and the bulls are mere inches away from a significant top, as the NDX swiftly dropped to the anticipated 12200 levels based on simple EWP-based wave-C = wave-A symmetry. If today’s low can hold going forward, the NDX can start moving back to its ultimate bull market target in the low 14000s.


Latest comments

Dr Arnout, do you feel EEM chart has topped out. Both NDX and EEM confirmed Head and Shoulders pattern
We all have to use our own minfs. I am still anticipating the end of a movemet to be terminated on March 15., alongside with ideas earlier presented by AtS. I am presuming that this is the end of a correction, but what actually happens from here to there and which indices add to this movement, I have no solid answer. Therefore just try to listen to the guidelines. None of us are entitled to a free meal, anyhow. I think this guy is good.
Keep moving that goal post good doctor
Fake news, you are seeing what you want to see. None of this is taking into account the real world situations causing the moves.
Once again, great ideas. The lack of symmetry between various indices and lack of constructivity is still probably the signature of a IV. The sideways movement is more apparent in the DAX. Hold on to your suggested target-date close March 15. Thank you, again.
I suppose it also is possible, in the worst case, that the DAX is in a triangle that is just about to rip. Either way, it is just a matter of matching the pieces as we go along.
Prices are high, because money is losing value
wow! when looking at those charts i cant help but think of what the german king said in amadeus after he saw mozarts opera ...  'too many notes!'. while not shown in the movie i think the king upon reading your article was heard to mutter ... 'too many commas'.
and oh yeah ... can you say 'major top'?
wow! when suffering through your comment, I can't help but think of the old saying "if I wanted to hear an a/$/$ho/e's opinion on the matter, I would just ********
perfect ideas Dr. Arnout all thanks for you.
It's hard to say . Markets often go the wrong way for weeks before reality sets in.
What a prediction sir. You are the Master of Master in technical analyst. You predicted nasdaq would touch 12200 when nasdaq was at 13500.
i don't understand a little bit. Did Dr said it will start to bullish now to 14000?
Doc: I still see touch to 11847 next (in fact, 11780 which is currently 200 EMA daily).  Most like the sell-off will happen between Wednesday and Friday next week (per TD sell setup)
I've taken notice of this trend line too. I'm on the fence with this but another possibility is continued up trend that hugs the trend line from below, instead of above, with periodic sell offs. I don't see what happened recently as a completed correction. That has though become expected in an environment that literally demands intervention for continuous returns.
 why didn't you the same for daily chart.... why weekly?
 Monthly and weekly are larger timeframes and they are in play now for long-term trend *******  In fact, even the annual chart is in play as we completed TD 9 buy setup on the annual chart in 2020.  This generally leads to trend reversal in 1-2 bars.  These analysis do not have much to do with day trading except that your chances of winning are greater if you know monthly and weekly dominant trends
Dr. Arnout, based on "The cycle of stock market emotions" from your book, I am at the Despondency stage. Any suggestions on how to overcome this feeling? Xanax?
Hi Ali, thanks for purchasing my book. Much appreciated. I hope you like it. I actually did a webcast for my members on "trading psychology" yesterday, it may be worthwhile for you as well.
 I am half way through. So far, I like it a lot. I am going to have my psychologist wife read it too. Is that webcast available to non-members?
Risk Disclosure: Trading in financial instruments and/or cryptocurrencies involves high risks including the risk of losing some, or all, of your investment amount, and may not be suitable for all investors. Prices of cryptocurrencies are extremely volatile and may be affected by external factors such as financial, regulatory or political events. Trading on margin increases the financial risks.
Before deciding to trade in financial instrument or cryptocurrencies you should be fully informed of the risks and costs associated with trading the financial markets, carefully consider your investment objectives, level of experience, and risk appetite, and seek professional advice where needed.
Fusion Media would like to remind you that the data contained in this website is not necessarily real-time nor accurate. The data and prices on the website are not necessarily provided by any market or exchange, but may be provided by market makers, and so prices may not be accurate and may differ from the actual price at any given market, meaning prices are indicative and not appropriate for trading purposes. Fusion Media and any provider of the data contained in this website will not accept liability for any loss or damage as a result of your trading, or your reliance on the information contained within this website.
It is prohibited to use, store, reproduce, display, modify, transmit or distribute the data contained in this website without the explicit prior written permission of Fusion Media and/or the data provider. All intellectual property rights are reserved by the providers and/or the exchange providing the data contained in this website.
Fusion Media may be compensated by the advertisers that appear on the website, based on your interaction with the advertisements or advertisers.
© 2007-2024 - Fusion Media Limited. All Rights Reserved.