I don’t know why you’d mess around with dividend reinvestment plans (DRIPs) when you can “automatically” bag a 7.6%+ income stream and 95% upside with the strategy I’ll show you now.
Better yet, this outsized cash flow drops into your account every month! It takes almost no work. (Just one small, but potent, step, which I’ll show you shortly.)
Before we get to that, let’s look at how easy it is to use this strategy to grab dividends 4X bigger than the sub-2% payouts most folks bring in today.
This simple setup seems a lot like a garden-variety DRIP, but it has one quick “hack” that amps up our dividend and sets us up for fast 95% upside, too.
Sending DRIPs to the Dustbin
The humble DRIP is a no-brainer for most folks: offered by most brokerages, these plans automatically reinvest your dividends back into the company that paid them, That adds to your share count, which bulks up your income stream.
Sounds great so far, right? The best part is, you pay zero brokerage commissions on these purchases.
But there’s a blind spot in most people’s DRIP strategy: they limit themselves to the S&P 500. That’s an unappealing trade now, with the index trading at a still-frothy 22.6-times its last 12 months of earnings.
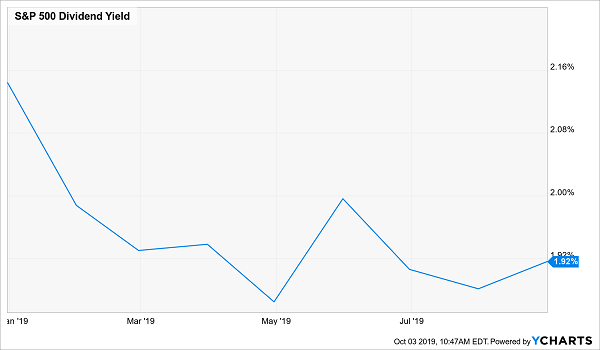
Meantime, the S&P 500’s dividend yield has gone from pathetic to truly pathetic as share prices have risen this year:
A Lousy Payout Gets Worse

The bottom line? Buying your typical S&P 500 stock now—either “direct” or through a DRIP—gets you a lower yield than you’d have gotten a few months ago.
This is where my strategy comes in. Because we’re going to “unplug” our dividends from the stocks that paid them and “redirect” this cash into stout dividend payers yielding that 7.6% I mentioned earlier.
The best part?
These income plays throw off a dead obvious signal when it’s time to buy or sell! All we have to do is wait for that signal to appear, then buy—and keep piling in our dividend cash as these investments roll higher.
That makes DRIPs obsolete!
Because why would we mindlessly roll our cash into a particular stock quarterly when we can pinpoint exactly when (and where) to strike for the biggest upside?
Here’s the best part: if you build a portfolio of the steady 7.6%+ payers I’ll show you in a minute, you could generate $42,000 a year in income on a $600K nest egg—nearly four times more income as an investor who sticks with the S&P 500.
And if you don’t need that cash now, great! You can put it back into these cash-rich income plays and grow your income even more. Cherry-pick the highest yielders and you’ll be set up for massive payouts of 8.9%, 9.1% and even 10.1%.
19 “Automatic” Ways to Bag 7.6%+ Dividends—and 95% Gains—Now
The stocks and funds I’m talking about are the 19 names I recommend in my Contrarian Income Report service (which I’ll show you when you click here).
Right now, these 19 sturdy stocks and funds yield 7.6%, on average, and six of them boast payouts above 8%, with their payout topping out at that 10.1% yield I mentioned a second ago.
I know what you’re thinking: “Brett, how can payouts that high possibly be safe?”
Let me put your mind at ease, because every month I run each through a rigorous “dividend-safety check,” starting with three critical factors:
- Rising free cash flow (FCF)—unlike net income, which is an accounting measure that can be manipulated, FCF is a snapshot of the cash a company is making once it’s paid the cost of maintaining and growing its business;
- A payout ratio of 50% or less. This is the percentage of FCF paid as dividends in the last 12 months. Real estate investment trusts (REITs) use a different measure called funds from operations (FFO) and can handle higher payout ratios, sometimes up to 90%;
- A healthy balance sheet, with ample cash on hand and reasonable debt.
How have we done?
Through up markets and down, our subscribers have bagged predictable 11.4% annualized returns since our launch in August 2015. Best of all, most of that gain was in cash, thanks to the portfolio’s outsized dividend yield.
DRIPs—the Smart Way
As I mentioned above, these 19 investments are perfect for dividend reinvestment because each gives us a clear signal when it’s time to buy or sell.
Consider closed-end funds (CEFs), an overlooked corner of the market where 7%+ dividends are common. We hold nine CEFs in our Contrarian Income Report portfolio, mainly larger issues with market caps of $1 billion or higher.
We don’t have to get into the weeds, but CEFs give off a unique signal that a big price rise is coming. That would be the discount to NAV, which is the percentage by which the fund’s market price trails the value of its portfolio.
This number is easy to spot and available on pretty well any fund screener.
This makes our plan simple: wait for the discount to sink below its usual level and make our move. Then we keep rolling our dividend cash into that fund until its discount reverts to “normal.”
How This Ignored Buy Signal Gave Us an Easy Double
This is exactly what happened when we bought the Cohen and Steers Infrastructure Closed Fund (NYSE:UTF) in February 2016, when it was throwing off a gaudy 8.8% yield.
When we pounced, UTF traded at a 16% discount! In other words, we snagged some of the best utility and infrastructure firms—whose pipelines, power grids, toll roads and airports are generating steadily rising cash flow—for 84 cents on the dollar!
How did we make this steal? Cast your mind back to early 2016.
Back then, first-level investors were worried about rising interest rates—specifically that higher rates would jack up utilities’ borrowing costs. Too bad they forgot that rising rates also signal a strong economy. And that means ever more demand for power and infrastructure.
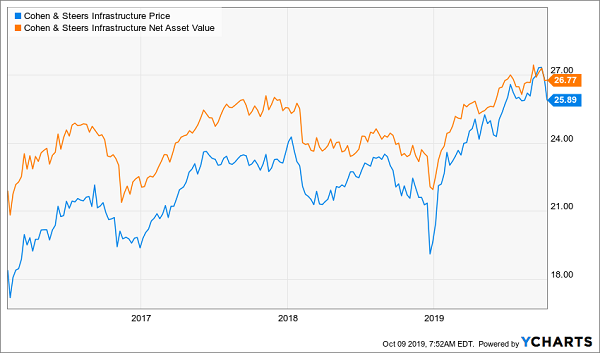
Not only did we collect the fund’s generous dividend, but we won two more ways during the nearly four years we’ve held UTF, when its:
- NAV increased (orange line below), and …
- Its discount window tightened as its price (blue line) caught up with its NAV.
2 Ways to Bag 95% Total Returns

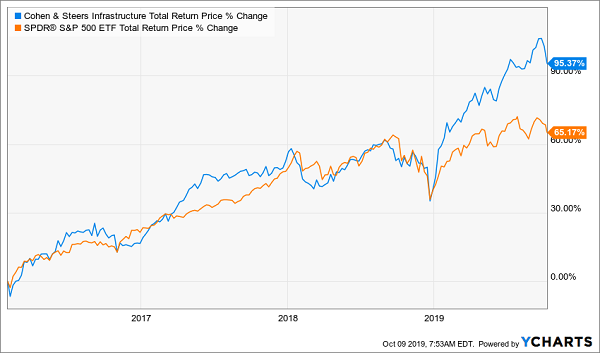
We’ve earned 95% total returns from UTF, thanks to the dividends we’ve collected, the NAV gains we’ve enjoyed and the discount window closing! And as you can see below, the average S&P 500 investor didn’t come close to UTF’s return—DRIP or no:
UTF’s Totally Predictable Outperformance

For most of UTF’s run, I’ve had a “buy” rating on the fund when this “twofer” potential remained in place, making it a perfect destination for both reinvested dividends and new cash my members had to invest.
But when UTF soars, and climbs over my buy-under price, we’re best to bank our UTF dividends (or “redirect” them to our other Contrarian Income Report buys) and wait for our next buy window.
4X Your Income With My “8% Monthly Dividend Portfolio”
I’ll let you know whether now is still a good time to put cash into this fund (which yields 7.1% as I write), when you take a no-risk trial to Contrarian Income Report (which you can do with no obligation whatsoever when you click right here).
Meantime, I’m not going to leave you hanging. Because the high-yield REITs and CEFs in my powerful “8% Monthly Payer Portfolio” are ALL ripe for buying now.
Taken together, these stout income plays pay you even more than UTF! And they pay 4X what your typical S&P 500 stock does.
I’m talking about a solid 8% dividend. So with just $500K invested, this dynamic collection of investments will hand you a $40,000-a-year income stream.
That’s easily enough for most folks to retire on without having to sell a single stock from their portfolios. And that means you don’t have to spend another minute worrying about the stock market. Because as long as your $40,000 income is safe, who cares what Mr. Market gets up to?
Best of all, you won’t have to deal with “lumpy” quarterly payouts like most folks do. Thanks to this breakthrough portfolio’s reliable monthly dividends, you can look forward to $3,333 in income, month in and month out!
Full details on these stout income plays are waiting for you here. You’ll discover:
Don’t miss your chance to tap this retirement-changing dividend stream while you can still do so cheap.
Disclosure: Brett Owens and Michael Foster are contrarian income investors who look for undervalued stocks/funds across the U.S. markets. Click here to learn how to profit from their strategies in the latest report, "7 Great Dividend Growth Stocks for a Secure Retirement."
