
MRC Global Inc. (NYSE:MRC) reported mixed results for the third quarter of 2019, wherein earnings beat the Zacks Consensus Estimate, while revenues missed the same.
The company’s adjusted earnings came in at 23 cents per share, surpassing the Zacks Consensus Estimate of 12 cents. Also, the bottom line increased 15% from the year-ago figure of 20 cents.
Weak Segmental Businesses Affect Revenues
In the reported quarter, MRC Global’s revenues totaled $942 million, reflecting a year-over-year decline of 12%. Revenues were adversely impacted by weak segmental results.
Further, the top line lagged the Zacks Consensus Estimate of $969 million.
MRC Global Inc. Price, Consensus and EPS Surprise
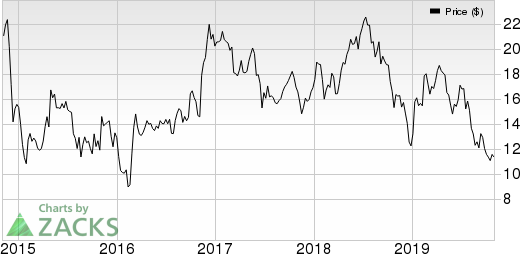
MRC Global Inc. price-consensus-eps-surprise-chart | MRC Global Inc. Quote
Based on MRC Global’s product line, revenues from carbon steel pipe, fittings and flanges declined 19% year over year to $298 million, and that from valves, automation, measurement and instrumentation declined 7.9% to $362 million. Revenues from gas products moved down 4.5% to $147 million. General oilfield products sales declined 14% to $92 million and that for stainless steel, and alloy pipe and fittings fell 10.4% to $43 million.
Revenues from the Upstream sector were approximately $287 million, declining 15.1% from the year-ago quarter. Midstream sales totaled $370 million, roughly down 12.3% year over year while Downstream sales totaled $285 million, declining 8.3%.
The company has three reportable segments — the U.S., Canada and International.
Sales generated from the U.S. segment totaled $763 million, declining 11.2% year over year. The results were adversely impacted by weakness in upstream, midstream and downstream businesses.
Revenues from the Canada segment moved down 26.9% year over year to $57 million due to weakness in upstream, midstream and downstream businesses.
Sales from the International segment declined 9% to $122 million. The results were adversely impacted by weakness in upstream and downstream businesses, partially offset by improvement in midstream business.
Gross Margin Down Y/Y
In the third quarter, MRC Global’s cost of sales declined 14.5% year over year to $768 million. Adjusted gross profit moved down 12.6% to $188 million. Margin came in at 20%, down 10 basis points. Selling, general and administrative expenses were down 2.1% year over year to $137 million.
Adjusted earnings before interest, taxes, depreciation and amortization (EBITDA) declined 22.5% year over year to $62 million while adjusted EBITDA margin was down 90 bps at 6.6%. Interest expenses were flat at $10 million.
Balance Sheet and Cash Flow
Exiting third-quarter 2019, MRC Global had a cash balance of $25 million, down 28.6% from $35 million at the end of the last reported quarter. Long-term debt balance declined 15.1% sequentially to $623 million.
In the first nine months of 2019, the company generated net cash of $134 million from operating activities versus $146 million used in the year-ago period. Capital spending totaled $12 million compared with $15 million a year ago.
In the first nine months of 2019, the company used $63 million for repurchasing shares and $18 million for paying out dividends.
Exiting the quarter, it had approximately $12 million left under its $150-million share buyback program authorized in October 2018. This program will expire by 2019 end.
Outlook
For 2019, the company anticipates to generate a minimum of $200 million of cash flow from operations compared with previously stated $180-$220 million.
Zacks Rank & Key Picks
MRC Global currently carries a Zacks Rank #3 (Hold).
Some better-ranked stocks in the same space are Carlisle Companies Incorporated (NYSE:CSL) , HC2 Holdings, Inc. (NYSE:HCHC) and KushCo Holdings, Inc. (OTC:KSHB) . All these companies carry a Zacks Rank #2 (Buy). You can see the complete list of today’s Zacks #1 Rank (Strong Buy) stocks here.
Carlisle delivered average earnings surprise of 18.58% in the trailing four quarters.
HC2 Holdings pulled off average positive earnings surprise of 48.55% in the trailing four quarters.
KushCo Holdings’ earnings surprise in the last reported quarter was 14.29%.
7 Best Stocks for the Next 30 Days
Just released: Experts distill 7 elite stocks from the current list of 220 Zacks Rank #1 Strong Buys. They deem these tickers “Most Likely for Early Price Pops.”
Since 1988, the full list has beaten the market more than 2X over with an average gain of +24.5% per year. So be sure to give these hand-picked 7 your immediate attention.
See them now >>
Carlisle Companies Incorporated (CSL): Free Stock Analysis Report
MRC Global Inc. (MRC): Free Stock Analysis Report
HC2 Holdings, Inc. (HCHC): Free Stock Analysis Report
KUSHCO HOLDINGS, INC. (KSHB): Free Stock Analysis Report
Original post
Zacks Investment Research