by Clement Thibault
This is the final installment of our four-part series on how specific groups of stocks repaid investors in 2016.
Part I, Best Comeback Stocks Of 2016, was published right before the Christmas holiday. Part II, SPX MVPs: The 5 Best Performing Stocks of 2016 was published early last week. Part III, Rookies Of The Year: The 4 Most Successful IPOs Of 2016 was published at the end of last week. We borrowed our designations from the world of sports. In this article we'll take a look at the stocks that most disappointed investors this past year, the picks that turned out to be busts.
Unfortunately for many investors, in the markets as in the rest of life, for every overachiever there is often also an underachiever. The U.S. equities markets in 2016 were no different in this regard.
While some stocks deserved recognition as top performers of the year, some highly touted, high-profile stocks didn't live up to expectations. Below are the four we think were most disappointing, plus a sector that was equally perturbing.
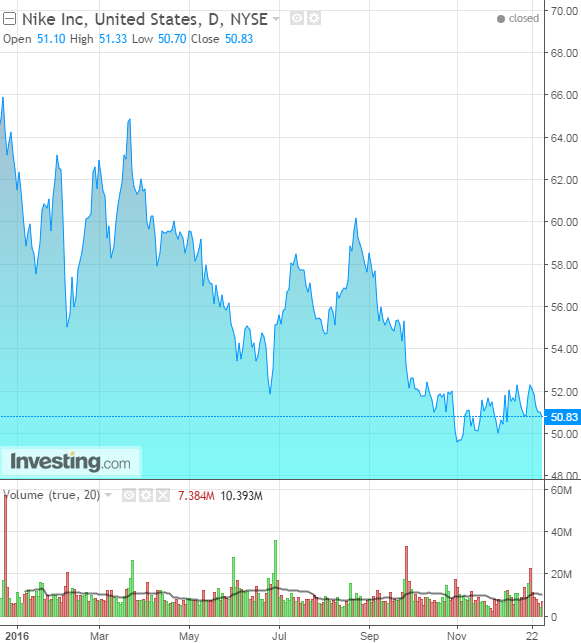
Nike, Inc.
- Closed 2015 at: $62.50
- Closed 2016 at: $50.83
- Gain/Loss: -$11.67, -18.6%
Nike (NYSE:NKE) earned its place on this list by being the Dow's worst performer in 2016. While the index rose 13.4% during the calendar year, Nike lost almost 19%. Interestingly, it's not that Nike did badly last year. Revenue continued to grow at a 6.95% pace on the year, and net income displayed growth of 7.3%. Nike is down because of concerns about the future of the company.
Competitors Adidas (OTC:ADDYY) and Under Armour (NYSE:UA) are mounting a strong challenge to Nike's position at the top of the athletic apparel heap. (More on Under Armour below.) Nike's shrinking gross profit margin (from 46.3% to 45.3% in the past year) and three straight quarters of misses in future orders expectations—the latest to 7% growth vs 8% expected—are clear signs that the future might be cloudy for Nike.
The year ahead: Nike is trading right now at early 2015 prices, and its valuation is attractive compared to its peers. Its P/E ratio of 22 is lower than Adidas' 29, and its price-to-free cash flow is also lower, at 39 versus 48. In sum, Nike is a very solid company hampered by future negative expectations. Given its current valuation and the fact that Nike is still a growing company, we expect it to have a much better year in 2017 compared to the one that just passed.
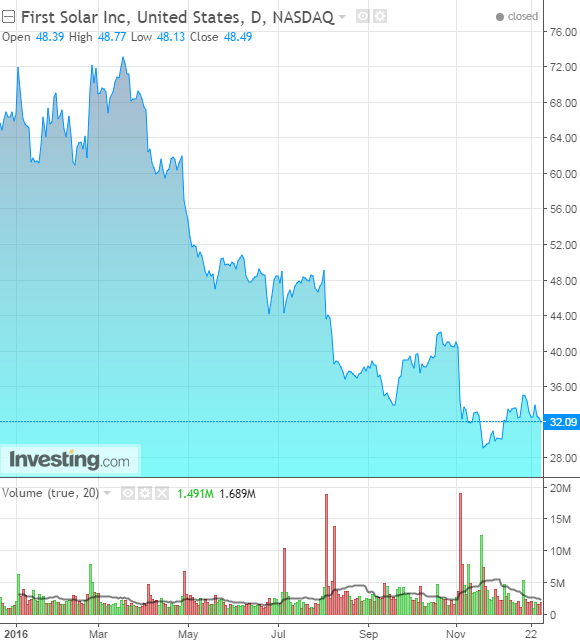
First Solar, Inc.
- Closed 2015 at: $65.99
- Closed 2016 at: $32.09
- Gain/Loss: -$33.9, -51.3%
First Solar (NASDAQ:FSLR) is the world's leading manufacturer and marketer of solar panels. Its share price in 2016 was hurt badly by a cascade of factors.
Slowing demand for solar panels in China led to an oversupply, which in turn brought prices down. In addition, the company made a strategic decision to aggressively jump ahead with its solar panel manufacturing model, ditching plans to develop a model 5 in favor of a more efficient and cost effective model 6.
This decision will lead to an approximately half-billion dollar impairment charge in the short-term, though it could have lots of benefits longer-term. Add to this President-elect Trump's widely covered notion that global warming is nothing more than a Chinese hoax, and FSLR found itself at the center of a vortex of investor fears that the renewable energy sector could be shunted aside in favor of more conventional, more polluting coal energy.
The year ahead: In light of uncertain governmental policies coming out of China and the as-yet untested Trump-led US administration, renewable energies will continue to be volatile in 2017. However, solar energy should be viewed as a long-term play and if you seek to open a position in this industry, First Solar is still your best option. The company holds over $2 billion in cash and equivalent with a $3.3 billion market cap. Its total price-to-book ratio is 0.56, which is considered very low. In comparison, SunPower (NASDAQ:SPWR), the second largest company in the industry, has less than $400M cash on $900M market cap, and a price-to-book ratio of 0.71.
Though both have respectable fundamentals, the market leader, First Solar, has the more attractive valuation, giving it a major advantage. First Solar's current ratio (sometimes referred to as working capital ratio) is a solid 2.46, while its debt-to-equity ratio is 0.13—both indicating that the company is not in danger of going under and could potentially absorb more blows. From an investment perspective, First Solar will probably be a longer-term ride that may not see much of a pay-out in 2017, but its prospects are still the best within the industry.
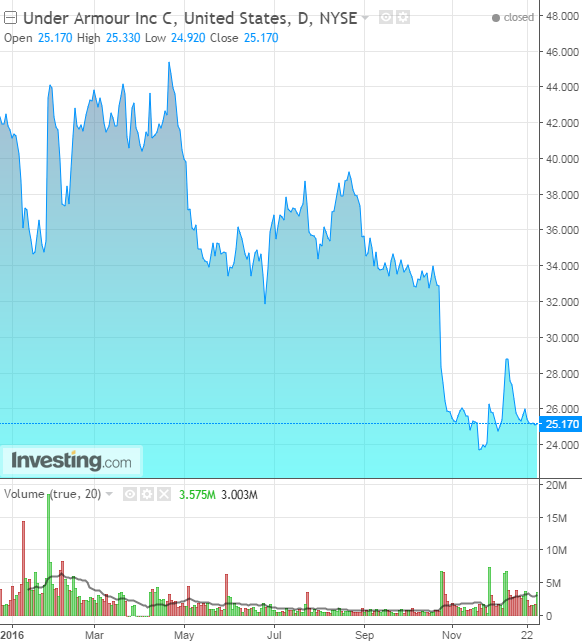
Under Armour, Inc.
- Closed 2015 at: $41.64
- Closed 2016 at: $25.17
- Gain/Loss: -$16.47, -39.5%
Under Armour's (NYSE:UA) story is one of classic failed expectations. Like Nike's situation described above, it's not that the company performed badly. Rather, its performance during 2016 simply didn’t live up to anyone's expectations.
The company started the year with a P/E ratio of 83 versus an industry average of about 28, clearly signaling that investors were expecting very strong growth in 2016. Unfortunately, Under Armour didn't deliver. Revenue growth peaked in the final quarter of 2015 at 30.7% yoy quarterly growth, but has since declined for three straight quarters. As with any highly valuated company, unfulfilled expectations have a tendency to hammer the share price until it falls to a point where investors believe it's in line with the new reality. The result, as can be seen with UA, is generally not pretty.
The year ahead: Under Armour is still growing its revenue at a 20% pace, but its P/E of 56 is currently still very high, indicating that most of the good (if not the best) case scenarios, are already priced in. The battle for market share in the sports apparel segment is heating up as well. That's not a good sign for a company that's expected to continue to grow at a strong pace.
The established leaders in this industry—most notably Nike and Adidas—have their work cut out for them with Under Armour, which has been providing a breath of fresh air via greater choice and new designs. Still, we don't believe that now is the time for investors to take a new position in UA. Far better would be to wait and see which direction fundamentals take in 2017.
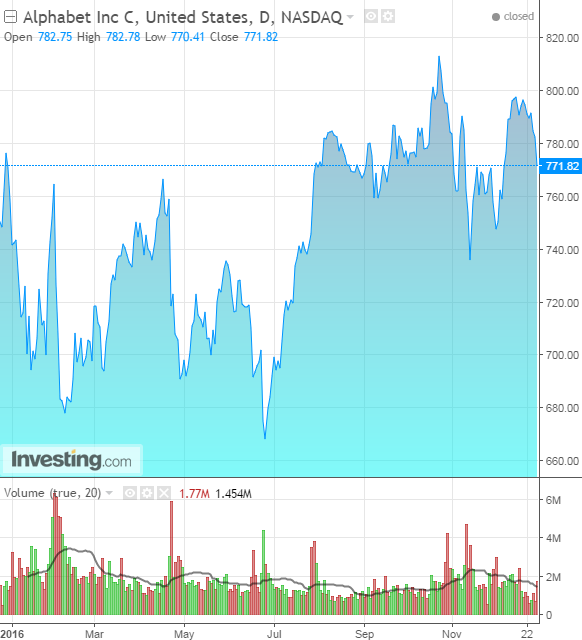
Alphabet, Inc.
- Closed 2015 at: $758.88
- Closed 2016 at: $771.82
- Gain/Loss: +$12.94, +1.7%
As we've mentioned, this isn't a worst performers list. Rather it's a list of the most disappointing stocks from the past year. In that regard, Alphabet (NASDAQ:GOOGL)—even with its positive return on the year—belongs on this list. With just 1.7% growth in its share price, the second largest company in the world by market cap lags the index it heads up by 8% on the year.
While Alphabet continues to grow strongly, regularly beating earnings expectations, there is some analyst and investor concern regarding lower search volumes alongside the higher cost of traffic acquisition, which may have helped keep the stock in check in 2016. Its share price also fell almost 10% the week after Mr. Trump was elected, in complete divergence from the market's rally over the same time period, because it is unclear exactly how the new U.S administration will affect top tech companies.
The year ahead: Alphabet still enjoys a very large competitive moat in the search engine arena, as well as in mobile operating systems since it owns android. Alphabet's P/E ratio is 28, which, while on the higher side, is expected to flatten out over the next year to a more realistic 18.7. Nevertheless, Alphabet continues to defy expectations. And the more its product is used, the wider its moat grows. We don't expect Alphabet will lag the market for a second year straight.
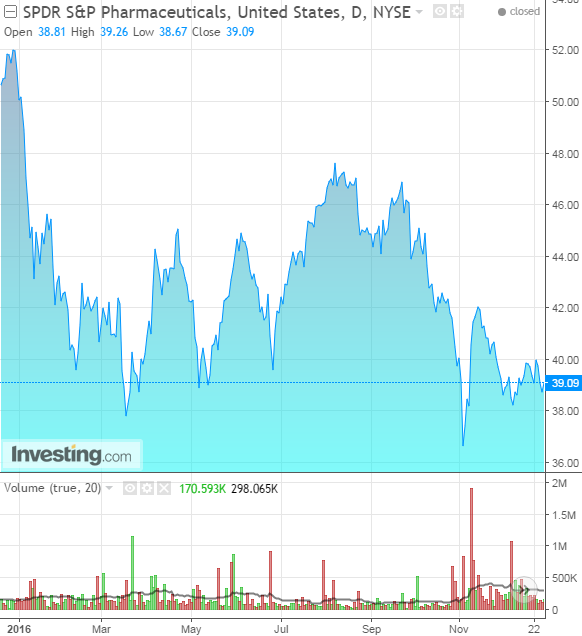
Bonus: Pharmaceuticals Sector
It's been a rough 2016 for many companies in the Pharma sector, which has been hurt by increasing competition, multiple scandals including price gouging, price fixing and payoffs. All of this in turn has focused a harsh spotlight on company business models and morals. As a result demands for much stricter regulation have proliferated. And individual companies have suffered, whether rightly or not.
Notable underperformers include: Mylan (NASDAQ:MYL), down 29% after the EpiPen pricing controversy; Teva (NYSE:TEVA), down 44.7% on bribery allegations, price fixing accusations, and the resignation of top personnel; Valeant (NYSE:VRX) (-85%) and Endo (NASDAQ:ENDP) (-73%), which, together with Martin Shkreli's Turing Pharmaceuticals, started the whole price gouging fiasco.
It seems that Merck (NYSE:MRK) (+11%) and Johnson & Johnson (NYSE:JNJ) (+12%) were the only companies able to come out ahead. Clearly, 2016 was truly a horrible year for the Pharmaceuticals industry.
In our view the jury is still out on how the Pharma industry will perform in 2017. Much will depend on the Trump administration's appetite for government regulation. Nevertheless, we believe most of the fear is already priced in and it's difficult to see how Pharma can have a second year as miserable as this past one.
