Some follow-up thoughts on yesterday's post.
There might be some more to think about regarding interest rate sensitivity and local supply constraints. I asserted yesterday that the decline in yields from 2000 to 2005 was concentrated among the more expensive cities, but that yields remained relatively stable in other cities during that time.
One implication is that expensive cities may be more rate sensitive. I am unusually flummoxed by the patterns here for some reason. But, digging around some more, I think I have become less sure of my intuition about sensitivity to interest rates and about relative housing yields across metros.
This first chart suggests the reason for expecting more yield volatility in expensive cities and possibly more sensitivity to interest rates. Clearly, over time, high rents have become an increasingly important factor in housing markets.
Systematically, where rents are higher, gross yields are lower. And, where rents are low, yields seem to remain relatively stable over time. The relationship between rent levels and yields moves up and down through hot and cold markets.
In other words, a bit counterintuitively, where rents rise, the rent/price ratio declines and becomes more volatile.
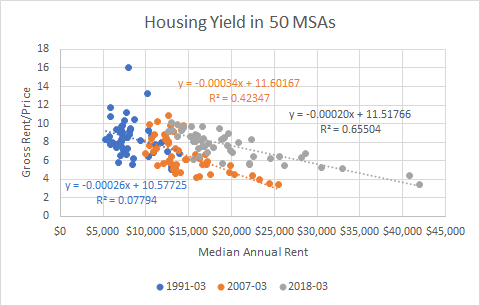
But, when I look more closely at cyclical changes, I just don't see the pattern that this suggests there should be. During the 2000-2005 boom, the Closed Access cities and the Contagion cities experienced anomalous declines in gross yields. Long term interest rates also declined during that time, but I think the decline in yields in those markets was a result almost purely of these anomalies.
In the Closed Access cities, the anomaly was mostly continued strong rent inflation, and in the Contagion cities, it was from short-term price surges having to do with big shifts in migration that stressed their local markets. Taking the Closed Access and Contagion cities out of the mix, in the rest of the country, if anything, housing in cities with higher yields was somewhat more sensitive to changing interest rates than housing in cities with lower yields.
As housing has moved through the aftershocks of the boom and the crisis, this seems to continue to be the case. Once those anomalies from 2002-2006 worked their way out of the system, housing seems to be only somewhat sensitive to long term rates, and it is more sensitive to rates where housing is less expensive.
Zillow has detailed rent data going back to 2014. Looking very broadly at the numbers up to 2014, gross rent/price was in the same range that it had been in the 1990s, and that this was more or less the case across MSAs. Over that time, 30 year TIPS rates had declined from about 3.5-4% to around 1%. One could suppose that this is because housing yields are not rate sensitive or because shifts to very tight lending had added a premium to housing yields, counteracting the change in TIPS rates.
I'm working very broadly here, but it appears that there could be three general forces at work. (1) expected rent inflation, (2) long-term real rates, (3) tight lending since 2007.
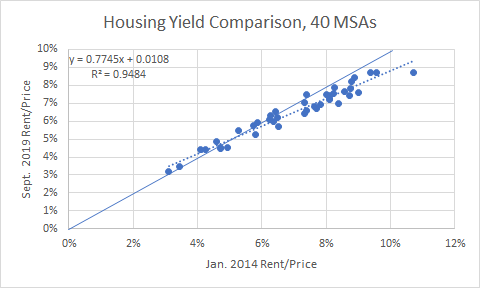
Previously, I suggested that expected rent inflation could explain differences in home prices across cities, plus about a 20% price increase due to declining rates. Rates have declined about that much again, since the boom. These two factors may be correlated, because if low rates trigger more home buying demand, that should lower rents where supply is elastic.
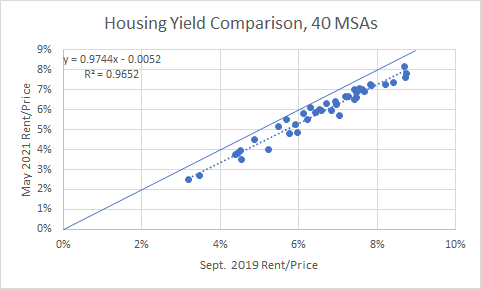
From 2014 to about September 2019, housing yields appear to have declined the most in metros with higher yields. This changed after September 2019, and maybe this has mostly been due to COVID issues, but since then, yields have declined across the board.
I suspect that part of what is going on is that there has been a temporary decline in rents in the expensive, low yield cities, which has temporarily lowered their yields. As those rents recover, yields in those cities will move back up. So, it appears that there is a systematic change since 2014 of yield compression. Yields in low-yield cities are staying about the same and yields in high-yield cities are declining.
This shift could reflect at least three factors:
1) Unsustainable bubble activity. This is always a popular choice. I am skeptical, of course, because in general the whole existence of this project of mine owes itself to discovering evidence, time after time, that has contradicted these types of explanations.
Also, as with so much housing data, the difference between cities dwarfs the changes within them. Should we call a decline from a 10% yield to a 8% yield a bubble when the country is full of cities with 6% yields? This would call for tight monetary and/or lending policies. Of course, I think that is likely the continuation of a wrong perception that has been knee-capping our economy for 15 years now.
2) Maybe prices in high-yield markets are more sensitive to interest rates. In that case, rising rates (if they ever come) might be associated with declining prices. I don't see much sign of loosening lending standards.
Most of the activity is still among those with high credit scores. If that is the case, loosening regulations on mortgage lending could be a useful countermeasure to help keep prices from collapsing if prices are sensitive to rising interest rates.
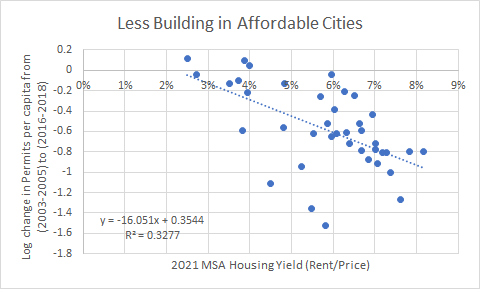
3) Maybe the convergence in yields is happening because all cities are becoming supply-deprived. In that case, strong growth and generous lending will be key. Why might this be the case? Building has been much lower in affordable, high-yield cities since 2005.
In this chart, there are a few outliers well below the regression line. Those are Contagion cities that were especially walloped by the financial crisis (Phoenix, Las Vegas, Orlando, etc.). Other cities have a quite high correlation.
Building has been low in affordable cities. I attribute this to tight lending. These cities tend to have lower incomes. And, because of this, rents have been rising broadly across MSAs. Recently, rents have moderated or fallen in the low-yield cities because of COVID migration.
In any case, less building could mean that buyers in all metros expect rents to be strong. This can be seen in vacancy rates, too. Vacancy rates have always been low in the low-yield cities. Vacancies in other cities are declining too, because of the lack of building.
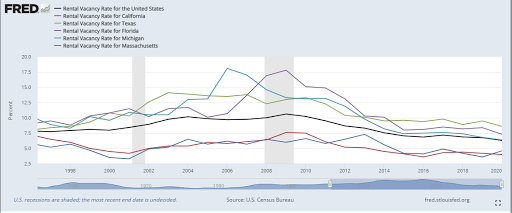
Of course, I would expect some combination of 2 & 3. Surely there is some sensitivity to real long-term interest rates. The questions are how sensitive home prices are to interest rates, how that sensitivity might differ across cities with different supply elasticities, and how much tight lending standards may have altered that sensitivity.
