Get 40% Off
🚨 Volatile Markets? Find Hidden Gems for Serious OutperformanceFind Stocks Now

Small Businesses Left Behind As Markets Rise

Published 05/21/2017, 01:32 AM
Updated 07/09/2023, 06:31 AM

From the Year-to-date comparison chart below of the 4 Major Indices, it's easy to see that the Nasdaq 100 Index has led this year's equity rally by a wide margin, while the Russell 2000 Index is, essentially flat, after a couple of foiled attempts to gain any traction.

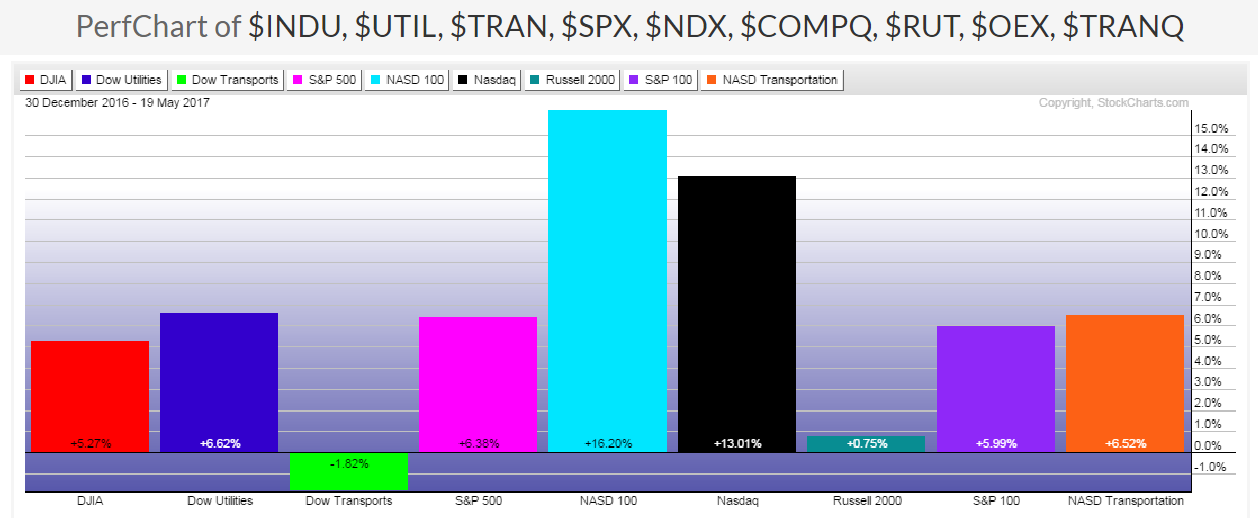
If the aim of President Trump's proposed health care plan, deregulation on businesses, tax cuts, and tax reform is to help small business owners, market players don't seem to be buying into that because of their rejection of small-cap stocks, so far, this year, as also depicted on the Year-to-date graph of the 9 Major Indices below.
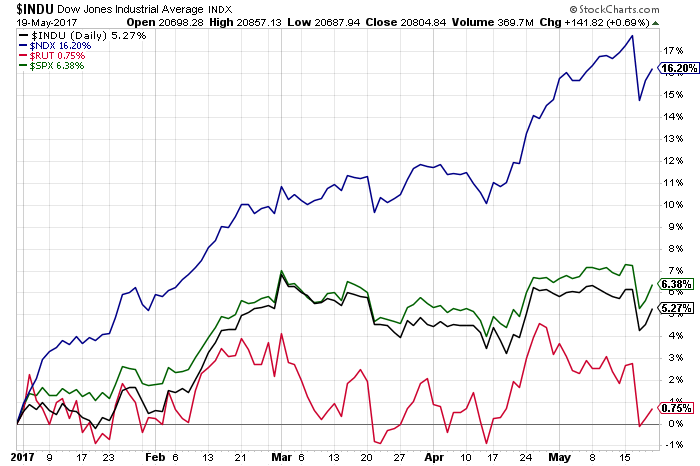
INDU- Daily
Indices Performance Chart YtD
In fact, money flowed out of small caps this week (along with most of the 9 Major Indices, as shown on the 1-week graph below.
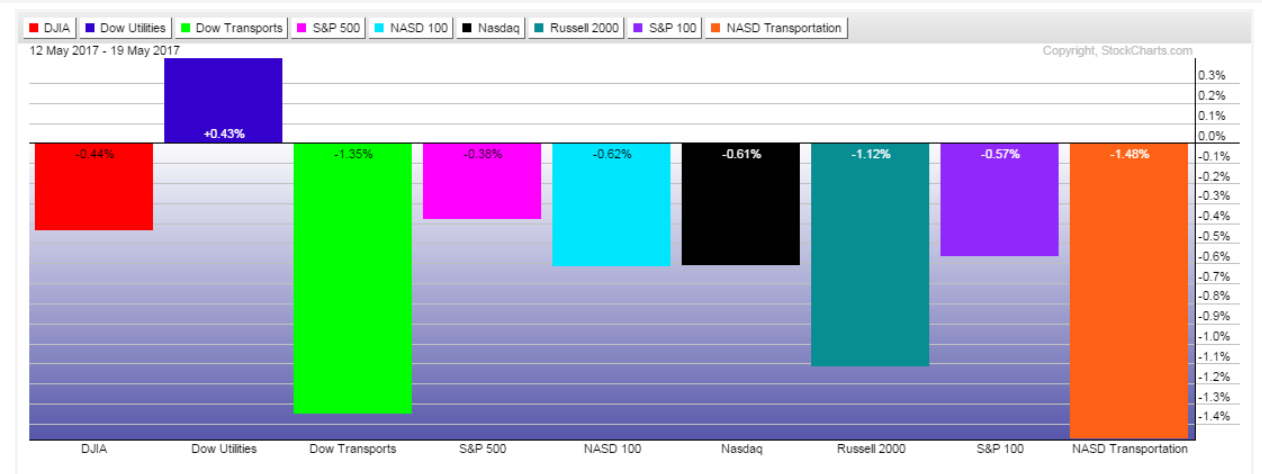
Indices Performance Chart May 12, 2017- May 19 2017
Furthermore, if the economy is doing so well and the Fed is busy raising interest rates (with the promise of more to come this year), why is the Financials sector flat this year, as shown on the following Year-to-date graph of the 9 Major Sectors?
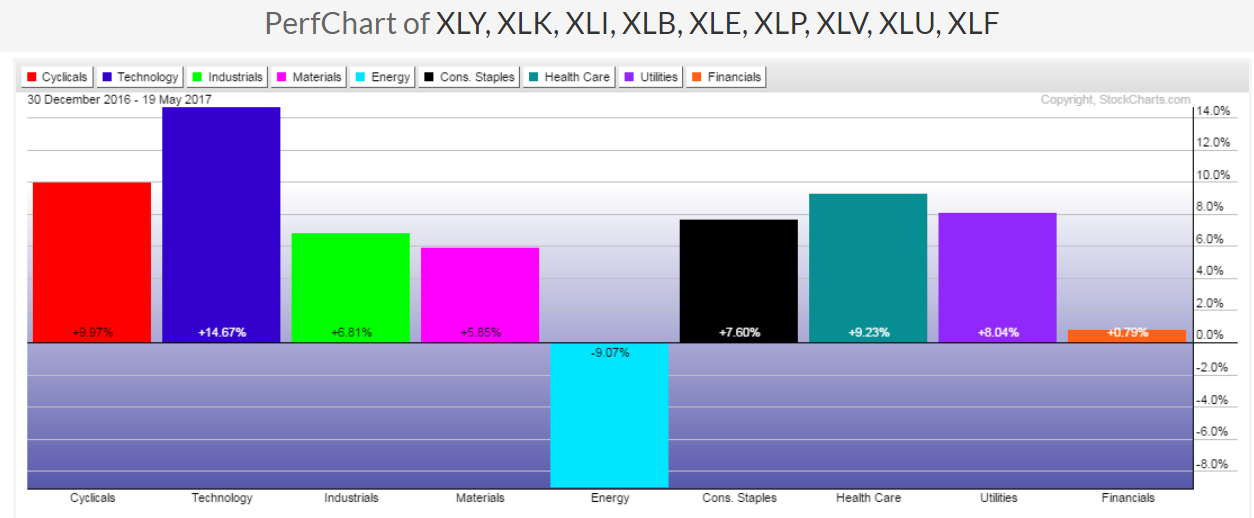
Financials sector Performance Chart YtD
In fact, money flowed out of Financials this week (along with most of the 9 Major Sectors, as depicted on the 1-week graph below.)
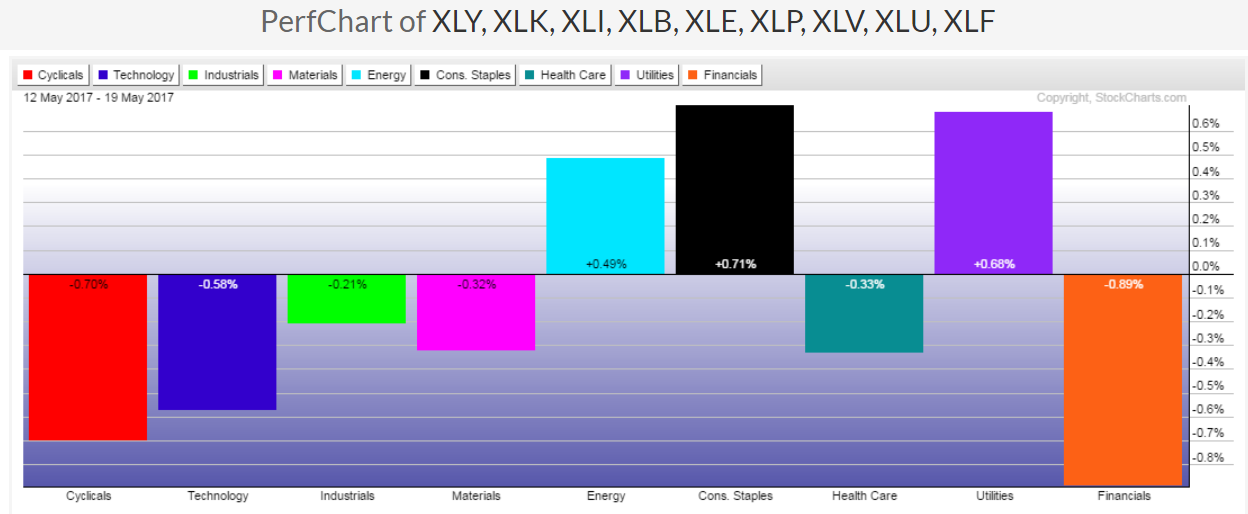
Financials Performance Chart May 12, 2017- May 19 2017
We'll see if the coming weeks present any buying opportunities for small-cap stocks and for the Financials Sector. Further weakening of these could negatively impact medium and large-caps stocks. However, Technology still holds the key to overall equity strength, in my opinion, as I described in my post of April 30.

3rd party Ad. Not an offer or recommendation by Investing.com. See disclosure here or remove ads .

At the moment, the Financials ETF (NYSE:XLF) is threatening to break below the neckline of a Head & Shoulders pattern, as shown on the Weekly chart below. A drop and hold below 23.00 could see a swift plunge down to major support at 20.00, or lower.
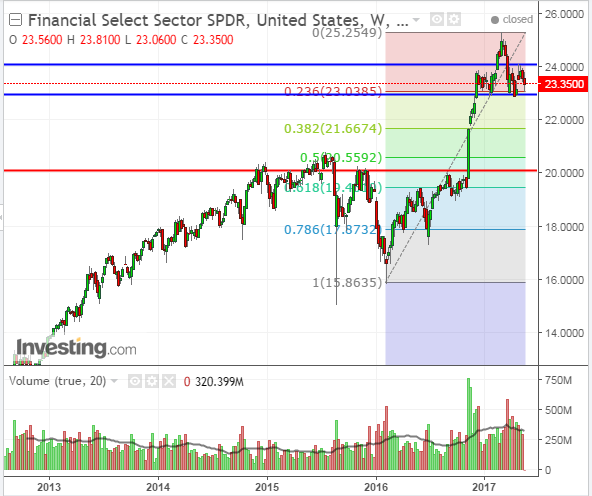
XLF- Weekly

Latest comments

Risk Disclosure: Trading in financial instruments and/or cryptocurrencies involves high risks including the risk of losing some, or all, of your investment amount, and may not be suitable for all investors. Prices of cryptocurrencies are extremely volatile and may be affected by external factors such as financial, regulatory or political events. Trading on margin increases the financial risks.
Before deciding to trade in financial instrument or cryptocurrencies you should be fully informed of the risks and costs associated with trading the financial markets, carefully consider your investment objectives, level of experience, and risk appetite, and seek professional advice where needed.
Fusion Media would like to remind you that the data contained in this website is not necessarily real-time nor accurate. The data and prices on the website are not necessarily provided by any market or exchange, but may be provided by market makers, and so prices may not be accurate and may differ from the actual price at any given market, meaning prices are indicative and not appropriate for trading purposes. Fusion Media and any provider of the data contained in this website will not accept liability for any loss or damage as a result of your trading, or your reliance on the information contained within this website.
It is prohibited to use, store, reproduce, display, modify, transmit or distribute the data contained in this website without the explicit prior written permission of Fusion Media and/or the data provider. All intellectual property rights are reserved by the providers and/or the exchange providing the data contained in this website.
Fusion Media may be compensated by the advertisers that appear on the website, based on your interaction with the advertisements or advertisers.
© 2007-2024 - Fusion Media Limited. All Rights Reserved.