It has been a challenging few years to be a monetarist. That isn’t because monetarist predictions have failed, but rather because monetarists have had to spend a lot of time explaining why money velocity has been declining (the answer is: low interest rates) and why “printing money” hasn’t led to runaway inflation (the answer is: inert reserves don’t count, but M2 money growth has been growing between 5%-8% for the last 5 years and that would be too fast for stable prices if velocity was stable).
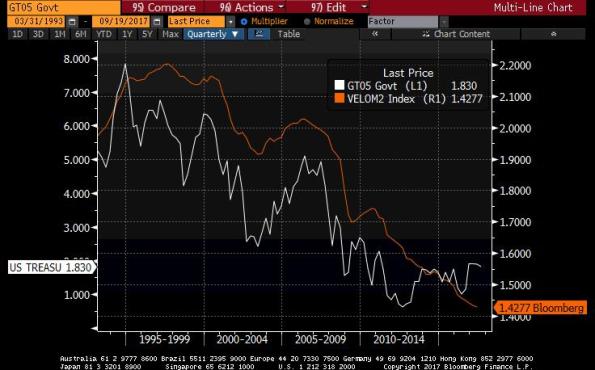
Money velocity declines when interest rates decline because the demand for real cash balances increases when the opportunity cost of those cash balances is low. That is, if interest rates are at 10%, then you won’t leave cash sitting around idle; it becomes a hot-potato and either gets reinvested in term loans or other assets, or spent. On the other hand if term interest rates are at 0%, then what’s the hurry? The chart below (source: Bloomberg) shows the simple relationship since the early 1990s between 5-year Treasury rates and M2 velocity. This is not a mystery – it has been a critical part of monetarist theory since the 1970s.
You can see that there is a modest conundrum, since interest rates bottomed a couple of years ago but money velocity has continued to sag. I don’t see this as a major mystery; it makes sense to me that there could be some nonlinearities in this relationship near and below the 0% level that we just don’t have enough data to resolve. These nonlinearities have certainly made forecasting more difficult and led generally to forecasts that were modestly too high compared with actual inflation outturns. Again, there’s no mystery about why the forecast misses – the mystery is why money velocity has remained low while interest rates have bounced (we believe economic policy uncertainty has led people to hold somewhat higher real cash balances than they otherwise would, but that’s just a hypothesis). At some point, higher interest rates will snap money velocity back as it gets too ‘expensive’ to leave cash balances sitting around. But this hasn’t happened yet.
Meanwhile, money growth has been slowing. It is still rising faster than 5% per annum, which means that if money velocity was stable and potential GDP growth is 2.5% then we would see the GDP Deflator rising at 2.5%. So money growth is still a bit too fast, unless money velocity is going to decline forever. But it is better at 5% than at 8%, to be sure.
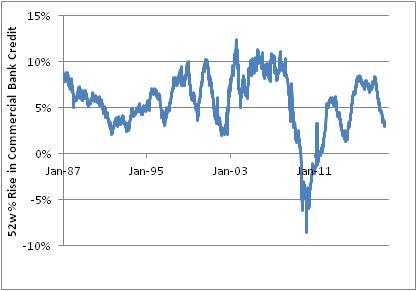
Credit growth has also been slowing, as the chart below shows.

Now, regardless of what you read credit growth has essentially no relation to money velocity. Obviously, credit growth has been fairly rapid – as money velocity continued to sag – and is now slowing – as money velocity has continued to sag. It is moderately better connected to M2 growth, so it tends to reinforce the notion that money growth is slowing somewhat, but people who are saying that velocity will continue to slow because banks are slowing loan growth need to explain why rapid growth didn’t lead to velocity acceleration. One-way relationships in economics are pretty rare.
I doubt very seriously that M2 growth is about to drop off a cliff. The Fed’s rate hikes and any balance sheet reduction is not going to affect money supply growth while bank reserves are still “abundant,” to use the Fed’s phrase. Banks are neither capital nor reserve-constrained at the moment, so a decline in credit growth is either coming from the supply side as banks voluntarily reduce loan growth perhaps because credit quality is diminishing, or it is demand side as borrowers are not seeing the growth opportunities that require financing. Money growth is still, and always, something to keep an eye on. But, just as changes in velocity dominated changes in money growth when velocity was falling, velocity changes will dominate changes in money growth when (if?) money velocity starts to rise. As the first chart above shows, velocity when interest rates were “normal” was around 1.8 or higher. I invite you to go to the calculator on the Enduring Investments website and play around using a starting money velocity of 1.43 to see what sort of money supply contraction is required to keep inflation low, if velocity returns to 1.80 over some period of time.
And then, realize that M2 has not declined on a y/y basis as far back as the Fed has records on FRED (about 1960). It seems unlikely to do so now. This leaves few low-inflation exit paths as long as money velocity isn’t permanently dead.
I think the decline in credit growth has implications, but they are mainly implications for growth and not for inflation. Along with the weakness that is starting to be seen in some other areas of the economy (e.g. autos, until the hurricanes caused some “forced replacement”), I think this could be seen as a harbinger of a potential recession in 2018.

